Bubble maps are a powerful tool for brainstorming, organizing ideas, and visualizing data. They can help stimulate creative thinking and make complex ideas easier to understand and remember. In this blog post, we will provide an overview of how to create a basic bubble map, including templates and tips.
What is a Bubble Map
A bubble map is a visual creative thinking tool that uses a graphic organizational structure of circles and lines to represent concepts and the relationships between them.
Bubble maps are useful for brainstorming, organizing information, and visualizing relationships between ideas. When creating a bubble map, you start with a central idea or topic in the middle of the page. Then you branch out from that central bubble by adding related ideas or concepts as smaller bubbles connected to the main one with lines.
The connections show how the smaller bubbles relate to the central idea. You can then continue adding more bubbles for sub-concepts branching off the original concepts. The bubbles get smaller as they move further from the center, showing decreasing importance or specificity.
Bubble Map Templates and Examples to Get Started
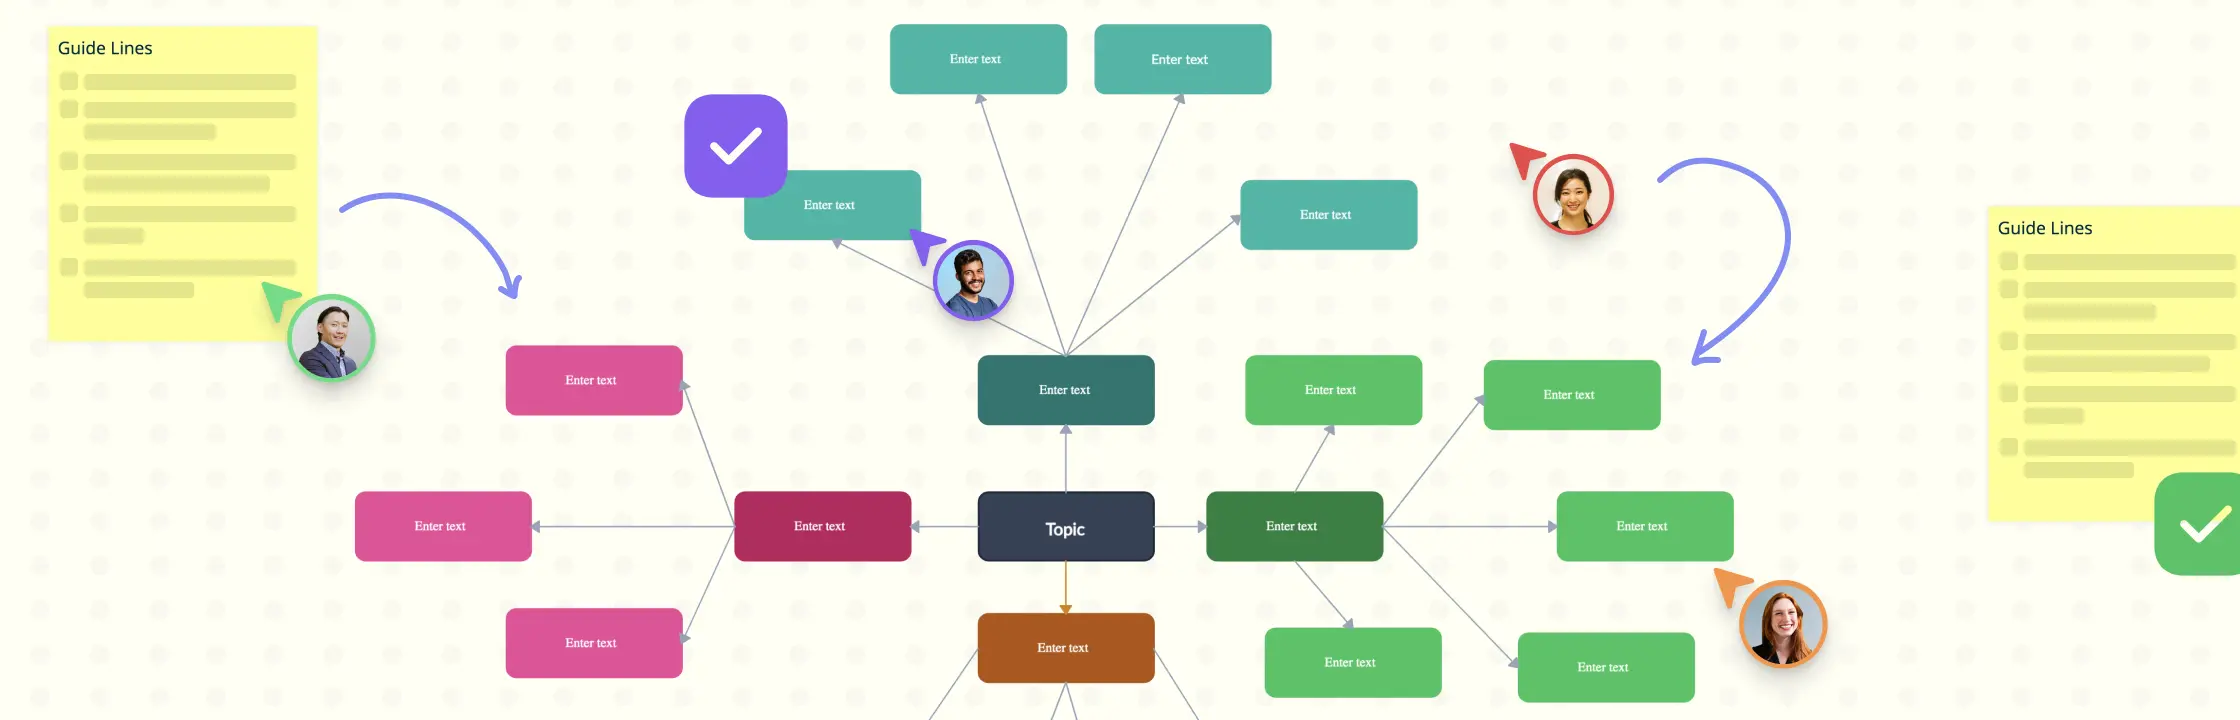
Bubble Map


Bubble Map Template

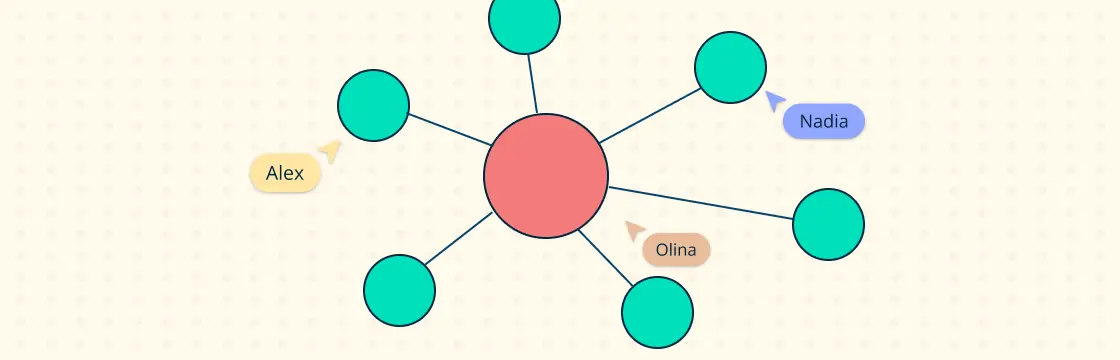
Double Bubble Map

Bubble Map

Double Bubble Map Example

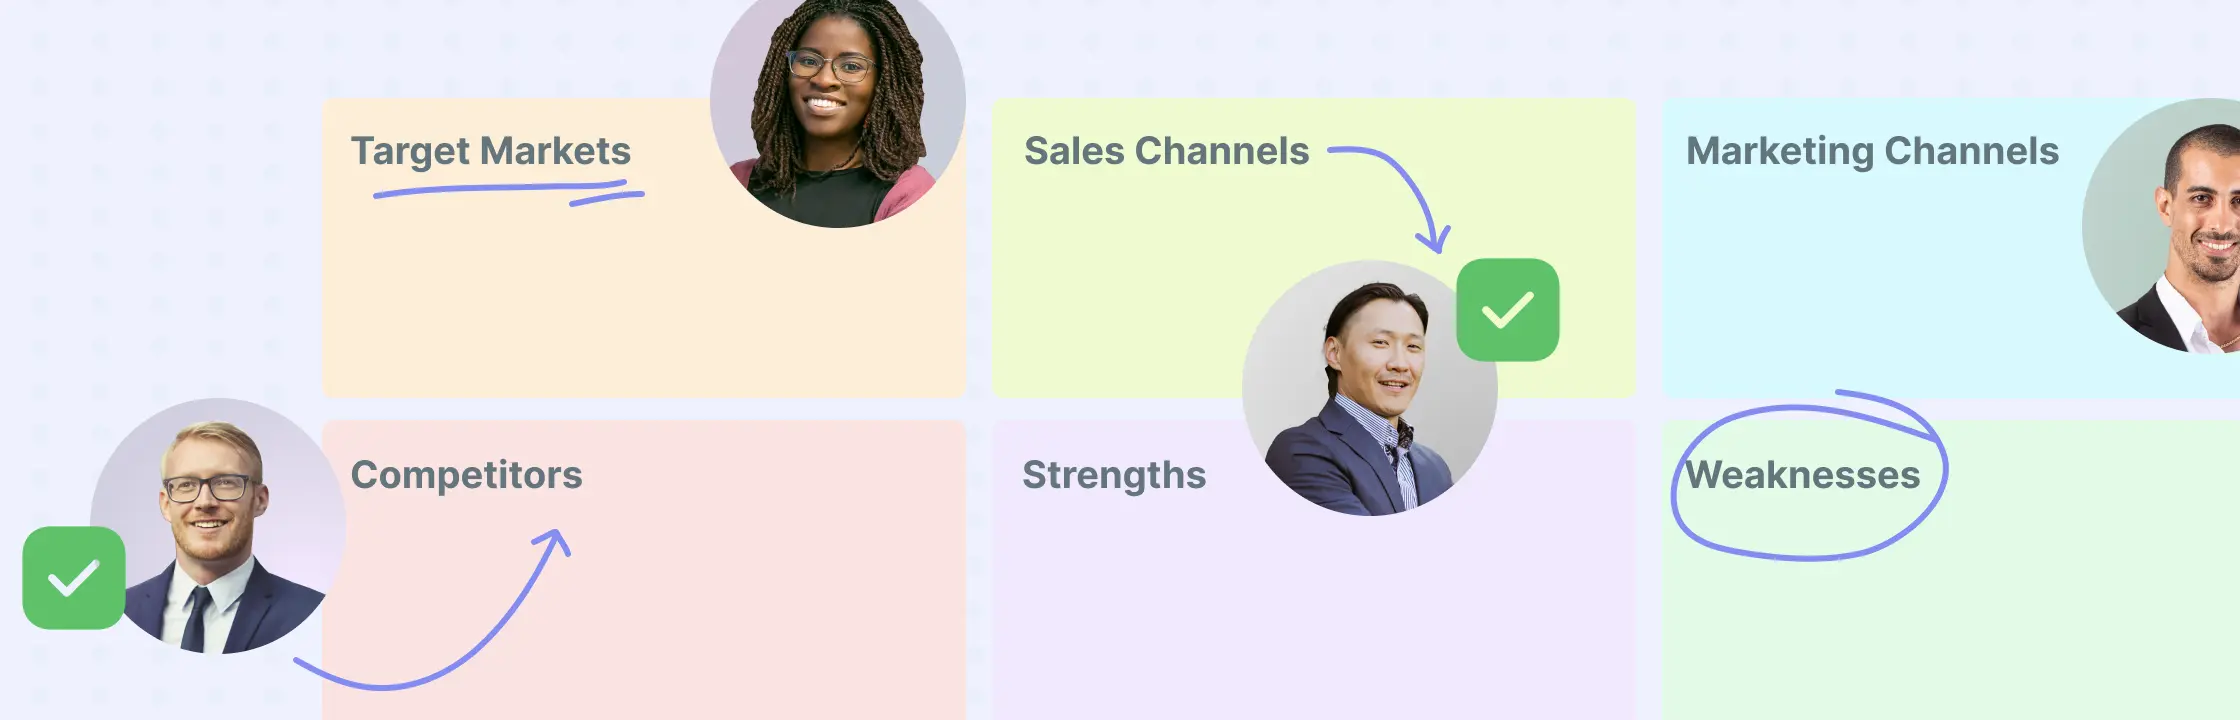
Bubble Chart

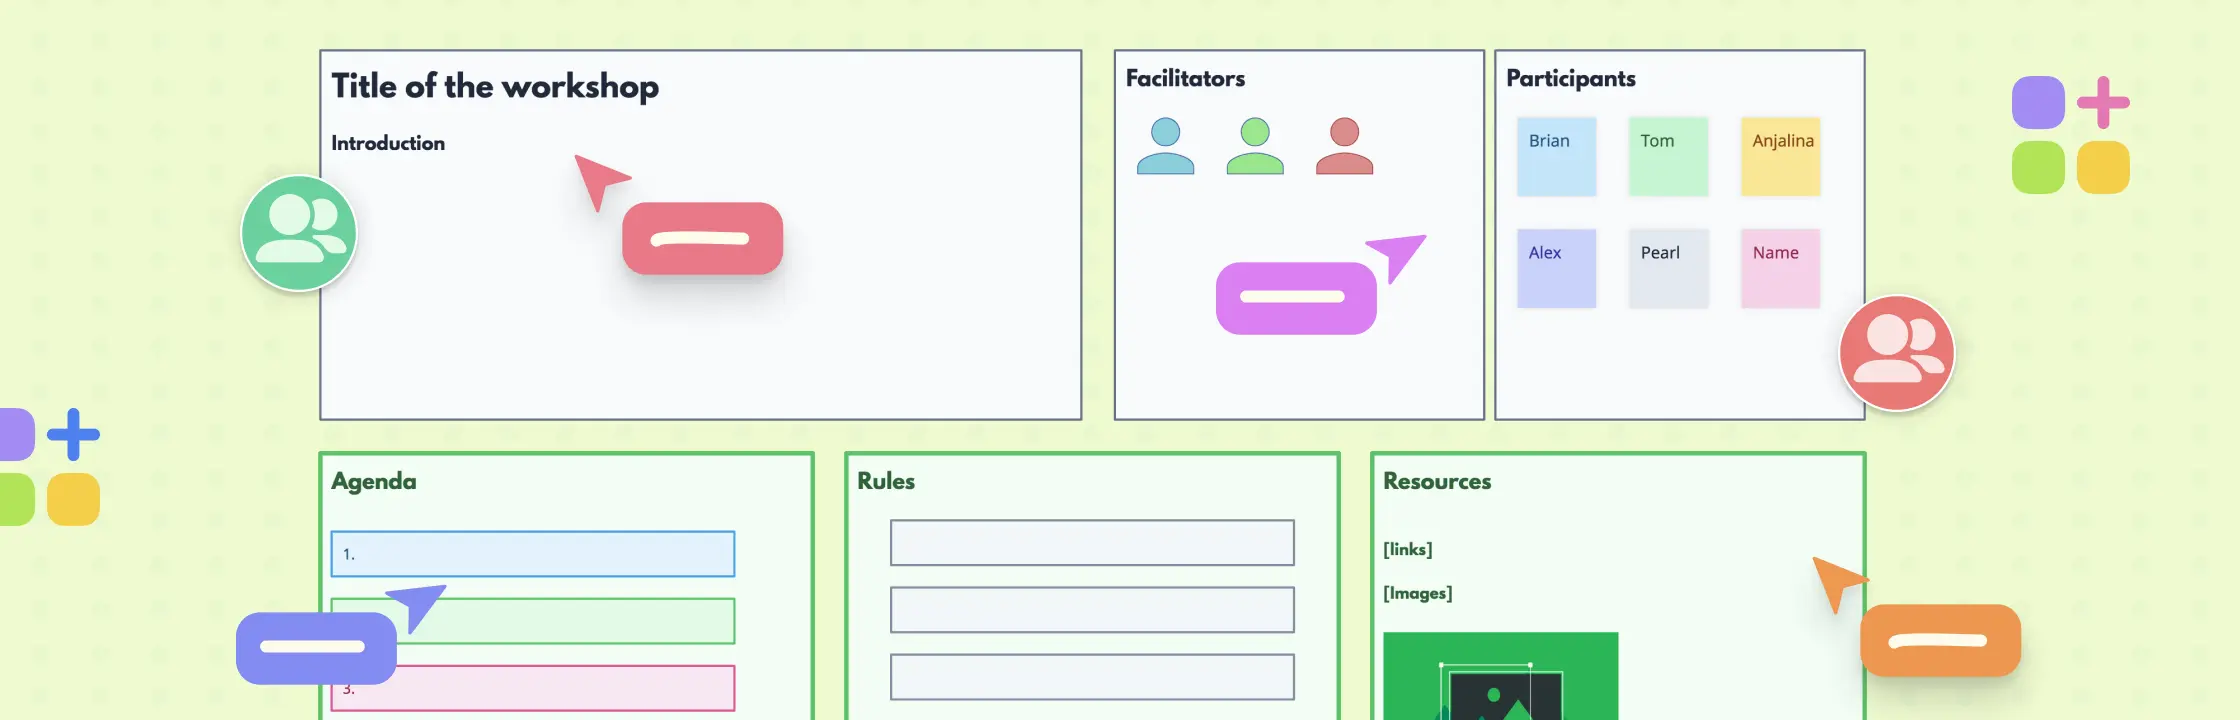
Concept Map

Concept Map Example

When to Use Bubble Maps
Bubble maps are useful anytime you need to generate, organize and sort a lot of information in a visual way that shows relationships between ideas. The layout makes connections obvious and helps you retain and recall the information more easily.
Brainstorming - Bubble maps are helpful to get your thoughts out on paper when generating initial ideas around a topic. They allow you to see connections that may not have been obvious at first.
Outlining - Creating a bubble map can serve as a first step in outlining a paper or project. The visual layout helps you organize your main points and subpoints.
Planning - If you have a large project to plan, like an event or redesign, a bubble map can visually lay out the major elements and sub-elements you need to consider.
Studying - Making a bubble map of course material can help you review and retain information. Seeing how ideas relate helps cement them in your memory.
Problem-solving - Mapping out the components of a problem can help you brainstorm possible solutions. You can then add bubbles with potential solutions and how they address each part of the problem.
How to Create a Bubble Map
Creating a bubble map is a straightforward process, and you can do it on paper or using a diagramming tool like Creately.
1. Start with a central idea
Write down your main idea or topic in the center of a blank sheet of paper or workspace. This will serve as the core concept for your bubble map.
2. Create branches
Draw branches radiating outward from the central idea. Each branch represents a subtopic or aspect related to the main idea.
3. Add bubbles
At the end of each branch, draw a bubble and label it with a specific concept, idea, or keyword related to the subtopic. These are like mini-ideas connected to your main theme.
4. Make connections
Draw lines or additional branches to connect related bubbles. This illustrates the relationships between different ideas.
5. Expand and explore
Continue expanding the map by adding more branches, bubbles, and connections. Let your ideas flow freely, and explore different directions.
6. Use colors and visuals
Enhance your bubble map by using colors, images, or symbols. This can make it more visually appealing and help you remember the information.
Benefits of Using Bubble Maps
Creating bubble maps can offer several benefits, including;
- Bubble maps help organize ideas visually, making it easier to see relationships and connections between different concepts.
- They encourage creative thinking by allowing you to explore and expand on ideas in a non-linear way.
- Bubble maps provide a clear and focused representation of complex information, helping with better understanding and communication.
- They are simple to create on paper or digitally, and you can easily modify and add to them as your thoughts evolve.
- The visual nature of bubble maps helps with memory retention, making it easier to recall and understand the information later.
- Ideal for brainstorming sessions, bubble maps allow for the free-flowing exploration of ideas and concepts.
- Bubble maps can be applied in various fields, from education and business to project planning and problem-solving.
Tips to Create Better Bubble Maps
Here are some tips to help you create better bubble maps:
- Use simple and clear labels: Keep labels for bubbles and branches simple and clear. Use keywords or short phrases to convey ideas without unnecessary complexity.
- Organize by importance: Create a hierarchy by organizing branches and bubbles according to importance. This helps in presenting information in a structured manner.
- Be consistent: Use consistent formatting for branches and bubbles. This includes the size, color, and style of text or symbols to create a cohesive and organized appearance.
- Keep it simple: Avoid overloading each bubble with too much information. Keep each one focused on a single idea to maintain clarity.
- Use color and images wisely: Use color to highlight key points or to categorize related ideas. However, use colors sparingly to avoid overwhelming the map.
- Add visual elements: Enhance your bubble map with icons or images to make it visually appealing and help with memory retention. Visuals can add an extra layer of understanding.
- Connect with clear lines: Use clear and straight lines to connect bubbles, making it easy to follow the flow of ideas. Avoid cluttered or overlapping lines.
- Group similar ideas: Group related bubbles together to create clusters. This helps in identifying patterns and relationships between different concepts.
Use Creately to Create Bubble Maps
Creately offers a range of features that make it a powerful tool for creating bubble maps and other visual diagrams including mind maps and concept maps.
Easy tools for visualization
Creately comes with an intuitive visual canvas with simple drag and drop tools to visually organize ideas easily. Use extensive shape libraries for over 50 types of charts and diagrams to visualize any type of data and dynamic connectors that arrange themselves automatically to effortlessly connect and expand ideas on your bubble map
Easy customization
Configurable color themes and advanced text formatting capabilities highlight key ideas and connections between them.
Pre-made templates
Get a head start with multiple pre-made templates and frameworks for brainstorming, organizing ideas and visualizing data including bubble maps, mind maps, concept maps and graphic organizers.
Freehand drawing
Use freehand drawing on an interactive online whiteboard to conduct collaborative brainstorming sessions and facilitate classroom discussions.
Real-time collaboration
Work with any number of peers with synced previews and live mouse tracking. Have discussions and get things clarified with contextual comments.
Presentation mode
Quickly create interactive and dynamic presentations out of your bubble maps with the presentation mode.
Add images and notes
Import images and vectors to your bubble map to further elaborate information. Embed or attach documents and assets with in-app previews to provide more context with integrated notes and embeds.
Share, export, and embed
Embed your bubble maps in any site, or in Google docs, sheets, or slides, and Powerpoint presentations with a secure embed link. Or export your graphic organizers as SVGs, PDFs, and PNGs to publish, present, print, and share.
In summary, creating bubble maps encourages logical thinking, organization of information, and better memory through a visual representation of topics and their interrelationships. We hope this guide and the bubble map templates provided helps you get started easily with creating your next bubble map.