We’ve all felt it. The kickoff goes well, the intro emails go out, the playbook is in motion… and then things quietly stall. You follow up, get no response, and eventually realize the customer’s still stuck in a step you… Read More
We’ve all felt it. The kickoff goes well, the intro emails go out, the playbook is in motion… and then things quietly stall. You follow up, get no response, and eventually realize the customer’s still stuck in a step you… Read More
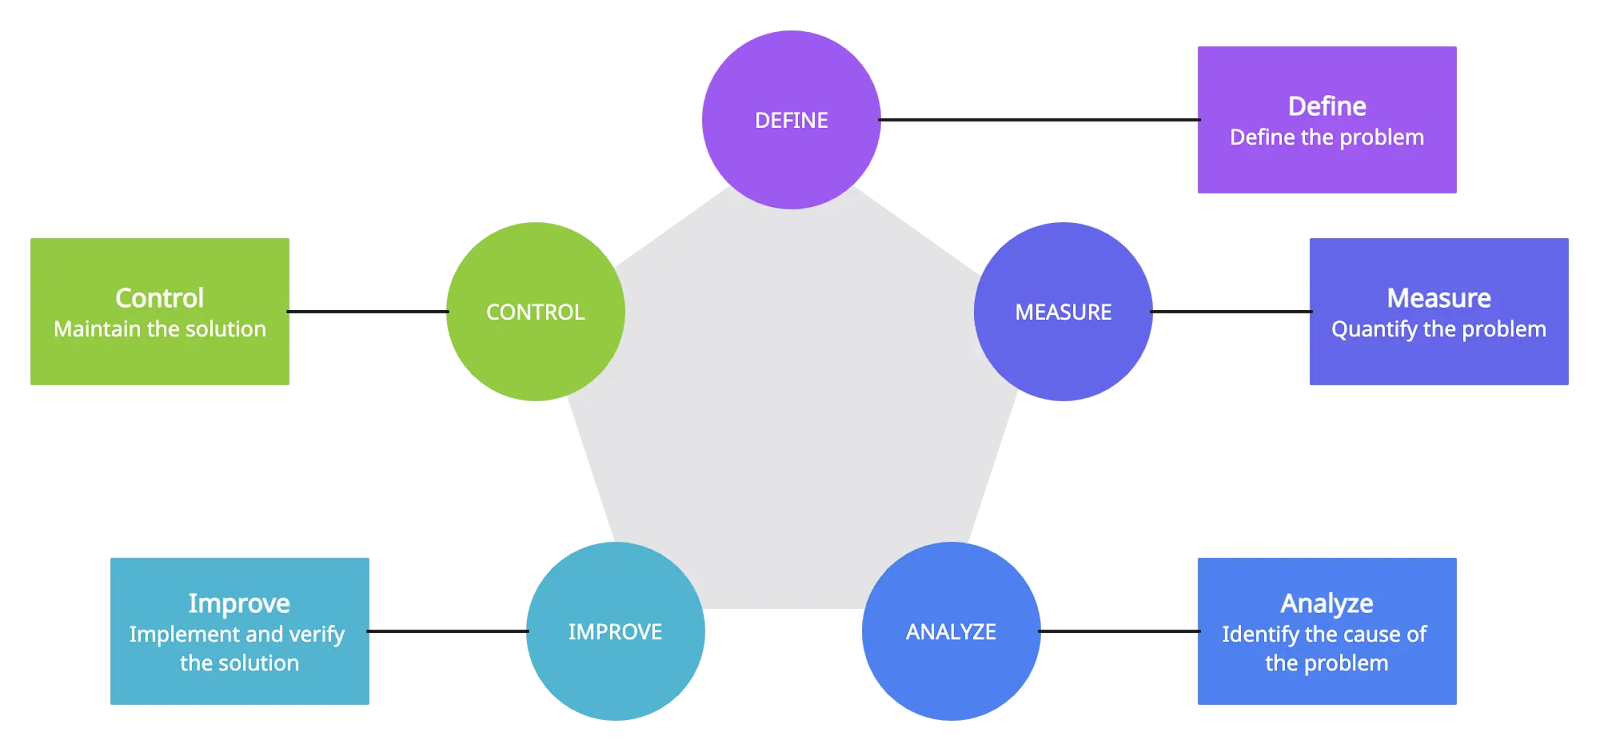
DMAIC (Define, Measure, Analyze, Improve, Control) is a five-step problem-solving methodology used to identify bottlenecks and improve processes. This methodology is part of the Six-Sigma philosophy, which started back in the 1980s in the manufacturing industry. The methodology remains relevant to date and is applied across various verticals, including project management and marketing. In today’s article, we’ll show you how to use DMAIC for social media marketing and the benefits you can expect. Let’s jump right in.
DMAIC stands for Define, Measure, Analyze, Improve, and Control.
These five steps can improve virtually any process when executed correctly. Let’s break them down.
The first step of the DMAIC process involves defining the problem. This step sets the foundation for the reset of the process, allowing you to identify the pain point that needs to be addressed and the metrics to track progress.
A thorough Define stage also gives you context about the problem. This is important as it can help you identify exactly where the bottlenecks are and what could be done to resolve them.
A nice example of a defined problem could be;
“The Instagram campaigns for our local coffee shop are racking up plenty of likes and comments, but we’re not seeing a lot of foot traffic.”
With this problem in mind, you’ll need to map out exactly why that’s happening and what the ideal outcome or solution would look like. This will require two main things:
The customer’s voice gives you more context around the issue. For example, could it be that the comments are filled with potential customers asking for directions or the menu of your coffee shop? If that’s the case, then you already have an idea of what a possible fix would look like. That brings us to the next step.
By the end of the Define stage, you should have a clear understanding of your problem, the context around it based on real customer insights, and a clear goal of the desired outcome.
Let’s go to the next phase.
Under the Measure phase, your objective shifts to data collection that can help you measure your current performance/process. The goal here is to get a baseline that you can use in the future to determine whether any changes you made translated into meaningful positive results (or negative results).
The first step here is to identify the right metrics. Let’s use the coffee shop example again here. Likes and comments are nice, but more importantly, you want to know how many people are tapping for directions, clicking the link in bio, and replying to your posts asking for directions. These metrics help you track tangible business outcomes.
Next, validate your measuring system to ensure that your data stays accurate. You can do that in various ways, like comparing Instagram insights with data from your Google Analytics. For example, how many people tapped for directions according to Instagram vs. how many people Google Analytics UTM data shows?
Make sure your measurements are accurate and the tools are reliable before moving to the next step.
During the Analyze phase, you’ll review your data to determine why likes, comments, and other engagements do not translate into foot traffic to your establishment. You can use different testing techniques here, including hypothesis testing and regression analysis.
You could start by comparing content themes with foot traffic in the case of a coffee shop. So, for example, you can look at the days or weeks when you had brunch-related posts vs regular latte posts and see how much geofenced foot traffic you got from each.
In another scenario, imagine you’ve identified “growing negative sentiment” as a problem. This is where you notice many negative comments about your brand or a specific product on social media.
Like in the previous example, you can start by analyzing the content theme to see if there’s a correlation between the type of content you’re posting and the negative sentiment. For example, if you notice that posts with a particular influencer attract more negative comments than before-and-after posts, then you may want to dig deeper into that influencer campaign strategy because it might be the problem.
Besides content themes, you can also analyze and test things like time and audience segmentation. For example, does posting at particular times result in higher taps for directions? Or are the negative sentiments mostly coming from a specific audience demographic?
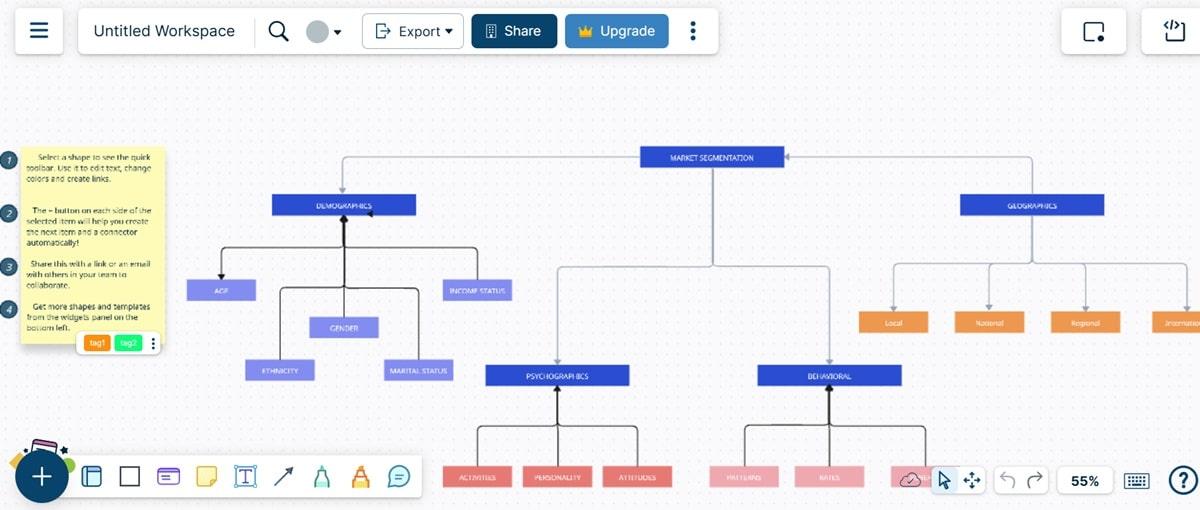
Creately’s market segmentation templates can be extremely valuable here.
You can also get a lot of value from using AI in this phase. Data analysis is one of the most powerful use cases of AI in marketing. You can use artificial intelligence to analyze your data and identify potential recurring themes, for example. You could also use it to brainstorm ideas for what elements you may want to test and analyze.
The analysis phase should give you a clear idea of what needs to be done to improve your social branding efforts.
For example, it may have shown that the type of influencer content you share (or even the specific influencer you’ve partnered with) is the reason behind the poor sentiment. Or perhaps your establishment was not getting enough foot traffic because you were posting at the wrong time, or did not have a clear address and working hours published online.
So, at this stage, you stop with the analysis and start fixing the problem. If you noticed that brunch-related content pieces drive more foot traffic, double down on that type of content. If high-end influencer campaigns produce more negative sentiment, stop the campaigns.
The fixes you come up with at this stage of the DMAIC process should target the specific friction points identified in the Analyze phase.
In the final phase, you will make sure that the improvements become part of your standard operating procedures. This is done to ensure that the improvements stick and that none of the key process participants fall back to initial practices that led you to the problem you had in the first place.
So, make sure that everyone involved knows what key performance indicators they need to track and what tools they should use. You’ll also want to document your new strategy and make it available to all your stakeholders.
Remember that Control is a continuous process. Track the relevant KPIs continuously and do a comprehensive analysis every quarter or biannually to determine if the strategy is still working. If it’s not, or in case you run into another issue, start the process again by defining the new problem.
Six Sigma can be beneficial for social media marketing in various ways. These include
Research also shows that for every $1 invested in Six Sigma organizations can get a direct saving of $2.
But while DMAIC can be very effective at resolving your social media marketing challenges, you must also be careful about how you implement it. A common trap you’ll want to avoid is creating a complex problem definition. This can cause problems by leaving your team confused about what exactly they should be trying to resolve, i.e., the objective.
Also, make sure to collect quality data. Remember, all your decisions will be based on that data.
The best part is that you don’t have to execute DMAIC from scratch. Creately provides DMAIC templates and process mapping tools to help you implement this methodology.
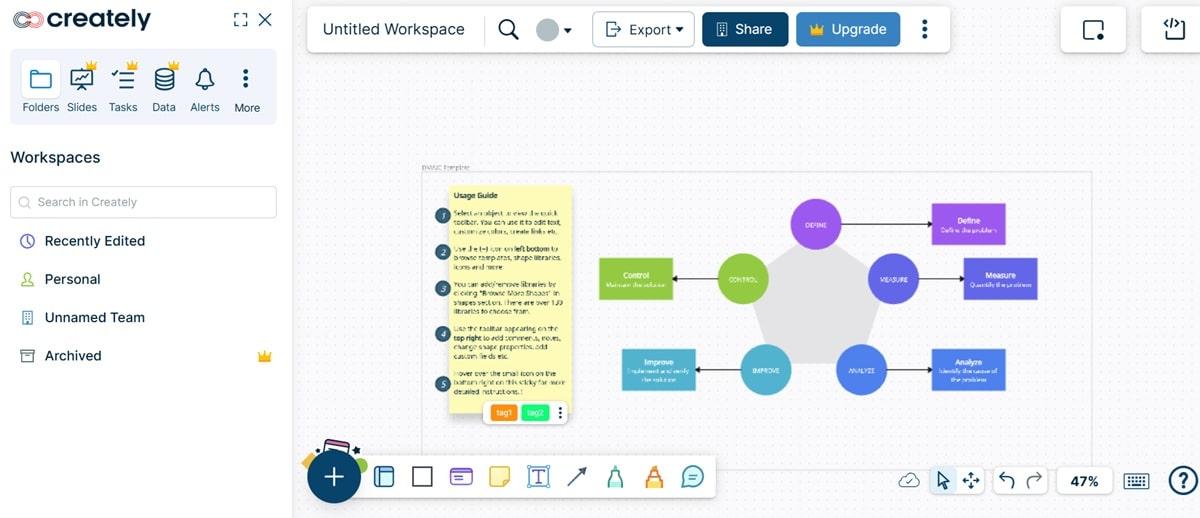
Creately’s tools will help you define your social branding goals, track the right metrics, and iterate your strategy as needed until you achieve your objectives.
DMAIC is an incredible Six Sigma tool that can help you identify a problem’s root cause, develop an effective solution, implement it, and track performance over time. Though the tool was initially used in manufacturing, the practices can be deployed anywhere.
This article has shown you how to use DMAIC for social media marketing. Start by clearly defining the problem. Remember to listen to the voices of your customers at this stage.
Then, measure your existing processes, analyze your data, improve the process based on the insights from the analysis phase, and finally, control the process by ensuring all stakeholders stick to the new strategies.

David Pagotto is the Founder and Managing Director of SIXGUN, a digital marketing agency based in Melbourne. He has been involved in digital marketing for over 10 years, helping organizations get more customers, more reach, and more impact.

According to Forrester, companies that map processes before automating see 42% faster implementation and 31% higher ROI. Precision and clarity are important, and the humble flowchart often serves as the unsung hero.
Whether you’re third-party robotic process automation tools, or a custom software solution, RPA process mapping can be the bridge between vision and execution.
Businesses use process maps in RPA projects because:
Let’s explore the principles of effective RPA process mapping, a real-life example and best practices for integrating them into your development lifecycle.
Flowcharts are visual representations of a process, depicting the flow of actions, decisions, inputs, and outputs. They transform abstract workflows into visual blueprints. Without them, automation projects is exposed to the following risks:
Here’s why they are especially useful in automation projects:
Automation often involves intricate workflows, conditional logic, and multiple stakeholders. Flowcharts help business users explain the developers how processes should work before any code is written.
Flowcharts reduce ambiguity, which helps developers and automation tools translate business logic into precise steps. This minimises the number of errors and revisions during implementation.
Having a visual reference makes it easier to identify where issues occur in the automation and validate that the logic flows as intended.
Mapping out the current (as-is) and desired (to-be) processes ensures stakeholders are aligned on scope and outcomes.
Designing the logic flow, including exceptions, approvals, loops, and branching, before development begins.
Developers use flowcharts to guide the structure of automated workflows or bots, especially when using tools like Power Automate, UiPath, or Zapier.
Flowcharts serve as documentation that explains how the automation works, crucial for onboarding new team members or undergoing audits.
| Symbol | Meaning |
| Rounded rectangle / Oval | Marks the beginning or conclusion of a process |
| Rectangle | An action or step in the process |
| Diamond | A branching point based on a condition |
| Square | A data input or system output |
| Arrows | Indicate the direction of the flow |
Creately has a flowchart library which include all of the flowchart symbols mentioned above and more.
In a recent digital transformation initiative, the Singapore Changi Airport replaced its manual pre-assessment for new IT and Digital projects with a fully automated solution.
Their pre-assessment process relied heavily on manual inputs, primarily through Microsoft Forms. However, once the data was captured, it needed to be reviewed and approved by 6 different teams (data engineering, cyber security, etc) for the project to go ahead. This meant little visibility of the project review status and frequent delays in gathering approvals and launching projects.
The organisation transitioned to a more robust and scalable solution using Microsoft Power Apps and Power Automate, to address these gaps. The goal is to enhance efficiency, minimise delays, and ensure accurate decision-making during the early phases of IT and digital project evaluations.
We started the project by using Creately’s flowchart software to visualise the process and clearly explain it to the developers.

The flowchart helped in the following areas:
When the project development started, the Power Apps developers referred to the process map to create a landing screen for all the teams. This screen enabled project team to submit new pre-assessments and view the status of ongoing assessments.

The project teams then populated all the required details needed for the pre-assessment by all the other teams in the next Power Apps screen. This helped Changi group to ensure that all the necessary details for the review are gathered and avoid delays due to missing information.

Finally, the project teams were able to see all the outstanding requests and their status. This increased the visibility throughout the process and ensured that all the stakeholders knew who is responsible for next steps of the review process.
Start by answering three simple questions:
List each step in the process chronologically, from input to outcome. Don’t worry about formatting yet, this is just about capturing what happens.
For example:
Ask questions like:
You can use anything from pen and paper to sophisticated digital tools. A popular option is Creately, which offers good functionality to create an industry-standard flowchart.
Now it’s time to sketch the actual flow:
Keep the following in mind:
Before proceeding to development or automation, walk through the flowchart with all stakeholders:
This step ensures alignment across business, technical, and compliance teams.
Once the process is visualised:
This is your chance to refine the process, not just digitise it.
Many automation tools allow you to build logic visually, much like your flowchart:
Use your flowchart as the source of truth when configuring workflows.
Once automation is live:
Avoid clutter, but don’t skip over critical decision points or subprocesses. Aim for clarity.
Maintain consistency across your diagrams. Standardisation helps teams quickly interpret flowcharts.
Break down large processes into smaller, modular flowcharts to make them easier to manage and maintain.
Validate flowcharts with end-users and analysts before development begins. This prevents scope creep and misalignment.
Many automation platforms (e.g., Microsoft Power Platform) offer visual editors that function like flowcharts. Start with conceptual diagrams and map them directly into your tool.
Flowcharts aren’t just for brainstorming; they are strategic tools that transform ideas into executable automation. In every phase of an automation project, from discovery to delivery, they provide clarity, improve collaboration, and reduce risk.
Don’t skip the flowchart if you’re starting your next automation initiative. It might just be the smartest first step you take, especially with a powerful flowcharting software like Creately to help you.

Eugene Lebedev is the managing director of Vidi Corp, a UK-based RPA and data analytics consultancy. Vidi Corp has delivered 1000+ projects for 600+ international clients including Google, Teleperformance and DS Smith.
Did you check our last week’s template round up post yet? Here are five new templates to help you with team building, UX design, and risk analysis. Use these templates, to streamline communication, foster creativity, and make better decisions within your projects.
This week, we are focusing on HR professionals and team members who wants to run effective meetings. These templates will facilitate the seamless execution of meetings, promoting efficient communication and collaboration among HR professionals and team members.
Discover a wide range of industry-specific templates and examples in our diagram community to help you manage your daily tasks efficiently.
This week’s templates include:
The Peer-to-Peer 1:1 Worksheet is designed for professionals seeking enhanced communication, strengthened relationships, and valuable feedback exchange across different departments. This template provides a structured platform to foster meaningful conversations and facilitate collaboration, making it ideal for building rapport and driving collective growth.
How to use the peer to peer 1:1 worksheet:
Click on the image to edit the peer-to-peer 1:1 worksheet
The 1-on-1 Meeting Template helps managers to establish meaningful connections with their direct reports. This template assists in conducting stuctured discussions, allowing managers to exchange feedback, cultivate trust, and collaboratively plan for individual and team development.
How to use the 1-on-1 meeting template:
Utilize the 1-on-1 Meeting Template to have impactful interactions with your team members. This simple yet effective template facilitates feedback sharing, trust building, and growth discussions, ultimately contributing to enhanced team dynamics and individual progress.
Click on the image to edit the 1-on-1 meeting template
The Effective Workshop Template helps streamline the process of addressing business challenges efficiently. Workshops provide a dynamic approach to problem-solving by bringing together key stakeholders to collectively tackle issues in a live and interactive environment. This template simplifies the workshop process, ensuring that valuable input and feedback are harnessed effectively.
How to use the effective workshop template:
Click on the image to edit the effective workshop template
The Career Progression Chart provides a visual representation of advancement within your company. This chart serves to clarify expectations, streamline promotion planning, and effectively communicate compensation ranges to potential candidates.
How to use the career progression chart:
Click on the image to edit the career progression chart example (marketing)
The Career Growth Plan Template is designed to understand, nurture, and guide your employees’ professional journeys. This template helps discover an employee’s values, preferences, competencies, and limitations. Use this template to set targeted goals and action plans, ensuring employees achieve their desired career growth.
How to Use the Risk Assessment Template:
Click on the image to edit the career growth plan
Did you check our last week’s template round up post yet? We shared five new templates useful for project planning that can help streamline planning, mapping, managing, and executing various tasks.
This week, we have five new templates that are helpful for team building, UX design, and risk analysis. These templates will help streamline communication, foster creativity, and improve decision-making within your projects.
Explore our diagram community to discover a wide range of industry-specific templates and examples that can help you efficiently manage your daily tasks.
This week’s templates include:
The icebreaker template is designed to foster team cohesion and energize group interactions. This online visual whiteboard template is a fantastic asset for team-building activities, workshops, and meetings. It encourages participants to engage, share, and connect with each other in a lighthearted and enjoyable manner. By breaking down initial barriers and building a positive atmosphere, the Ice Breaker template paves the way for more productive collaborations and open communication within the team.
How to use the icebreaker template:
Click on the image to edit the icebreaker template
The connect 4 dots ice breaker template is an interactive and engaging tool designed to strengthen team bonds and encourage meaningful conversations. This online visual whiteboard template offers a unique twist on the classic Connect 4 game, infusing an element of fun and friendly competition into team-building activities. The template promotes teamwork, problem-solving, and collaboration in a relaxed and enjoyable setting.
How to Use the Connect 4 Dots Ice Breaker Template:
Click on the image to edit the connect 4 template
The look, mock, analyze template is a handy tool for UX designers aiming to improve their designs through teamwork. This online visual whiteboard template simplifies the process of reviewing user interfaces, finding areas for improvement, and encouraging productive discussions. By guiding designers and stakeholders through a structured evaluation, this template contributes to creating user-friendly and effective digital experiences.
How to use the look, mock, analyze template:
Click on the image to edit the look, mock, analyze template
The card sorting template can be used by UX designers aiming to create user-friendly digital experiences. This online visual whiteboard template simplifies the process of understanding how users group and categorize information. By involving users in the organization of content, the template helps designers create intuitive navigation systems and information architectures that match users’ mental models.
How to use the card sorting template:
Click on the image to edit the card sorting template
The risk assessment template helps with risk analysis and management. This template simplifies the process of identifying, evaluating, and prioritizing potential risks in projects, processes, or initiatives. By systematically assessing risks, this template helps teams with making informed decisions to mitigate negative impacts and improve overall project success.
How to use the risk assessment template:
Click on the image to edit the risk assessment template
At Creately, we’re on a mission to transform the way teams work and collaborate visually. Our platform is designed to empower enterprises to fully harness the benefits of visual collaboration, driving productivity and fostering innovation.
Today, we’re excited to announce some significant advancements that further solidify our commitment to this mission.
We understand that for businesses, particularly larger enterprises, data security and compliance are non-negotiable. That’s why we’re proud to announce that we have achieved two key certifications: SOC 2-Type 2 and ISO 27001.
These certifications are widely recognized as important benchmarks in information security and management, demonstrating our commitment to maintaining stringent security standards. While these certifications have become a baseline requirement in today’s digital landscape, achieving them is nonetheless a significant accomplishment that emphasizes our dedication to securing your data and delivering a trusted service.
In line with our commitment to security and compliance, we’re thrilled to offer new data residency options. Creately users can now choose to store their data in the US, EU, or AU data centres. This new feature ensures adherence to local data sovereignty laws and provides enhanced data security.
Creately’s data residency solution however is unique. While your organization’s data may reside in a certain geography, you still want to seamlessly collaborate with external teams distributed across the globe.
Our advanced architecture allows Creately users data hosted from different regions to collaborate on workspaces. Logging in as a US Creately user, you can still accept external invitations to collaborate in EU hosted Creately workspaces without skipping a beat.
And all this is done without leaking personal data to other regions and fully complying with sovereignty laws!
In addition to these security enhancements, we have also introduced improved features to further optimize the visual collaboration experience. With faster diagram creation experiences, additional libraries, templates, and shapes, we offer an intuitive and efficient way for teams to collaborate visually.
By integrating Data with Visual Collaboration, we’ve unlocked new possibilities in areas such as Product Management, User Journey Mapping, Process Mapping, HR planning, and more. These features enable cross-functional teams to work more effectively, fostering creativity and innovation across your organization.
Finally, we’re shaking up the traditional SaaS pricing model with our ‘Unlimited Collaboration’ plan. This groundbreaking approach eliminates seat count restrictions, enabling an unlimited number of users within an organization to use our platform for a fixed fee.
This new model democratizes access to visual tools, allowing everyone in your organization to leverage the power of working visually, regardless of their role or function. By removing the barriers of traditional pricing models, we’re making it easier than ever for enterprises to unlock the full potential of visual collaboration.
These enhancements are a testament to our commitment to enabling organizations to unlock the full potential of visual collaboration, underpinned by robust security and compliance.
We’re excited to continue on this journey with you and look forward to empowering ambitious teams with the tools it needs to innovate, collaborate, and succeed in the visual collaboration era.