Understanding your family’s history involves more than just names and dates, it’s about uncovering the stories and connections that define your lineage. This guide explains the differences between genograms and family tree diagrams, their importance, and how Creately can help you create them.
What Are Genograms?
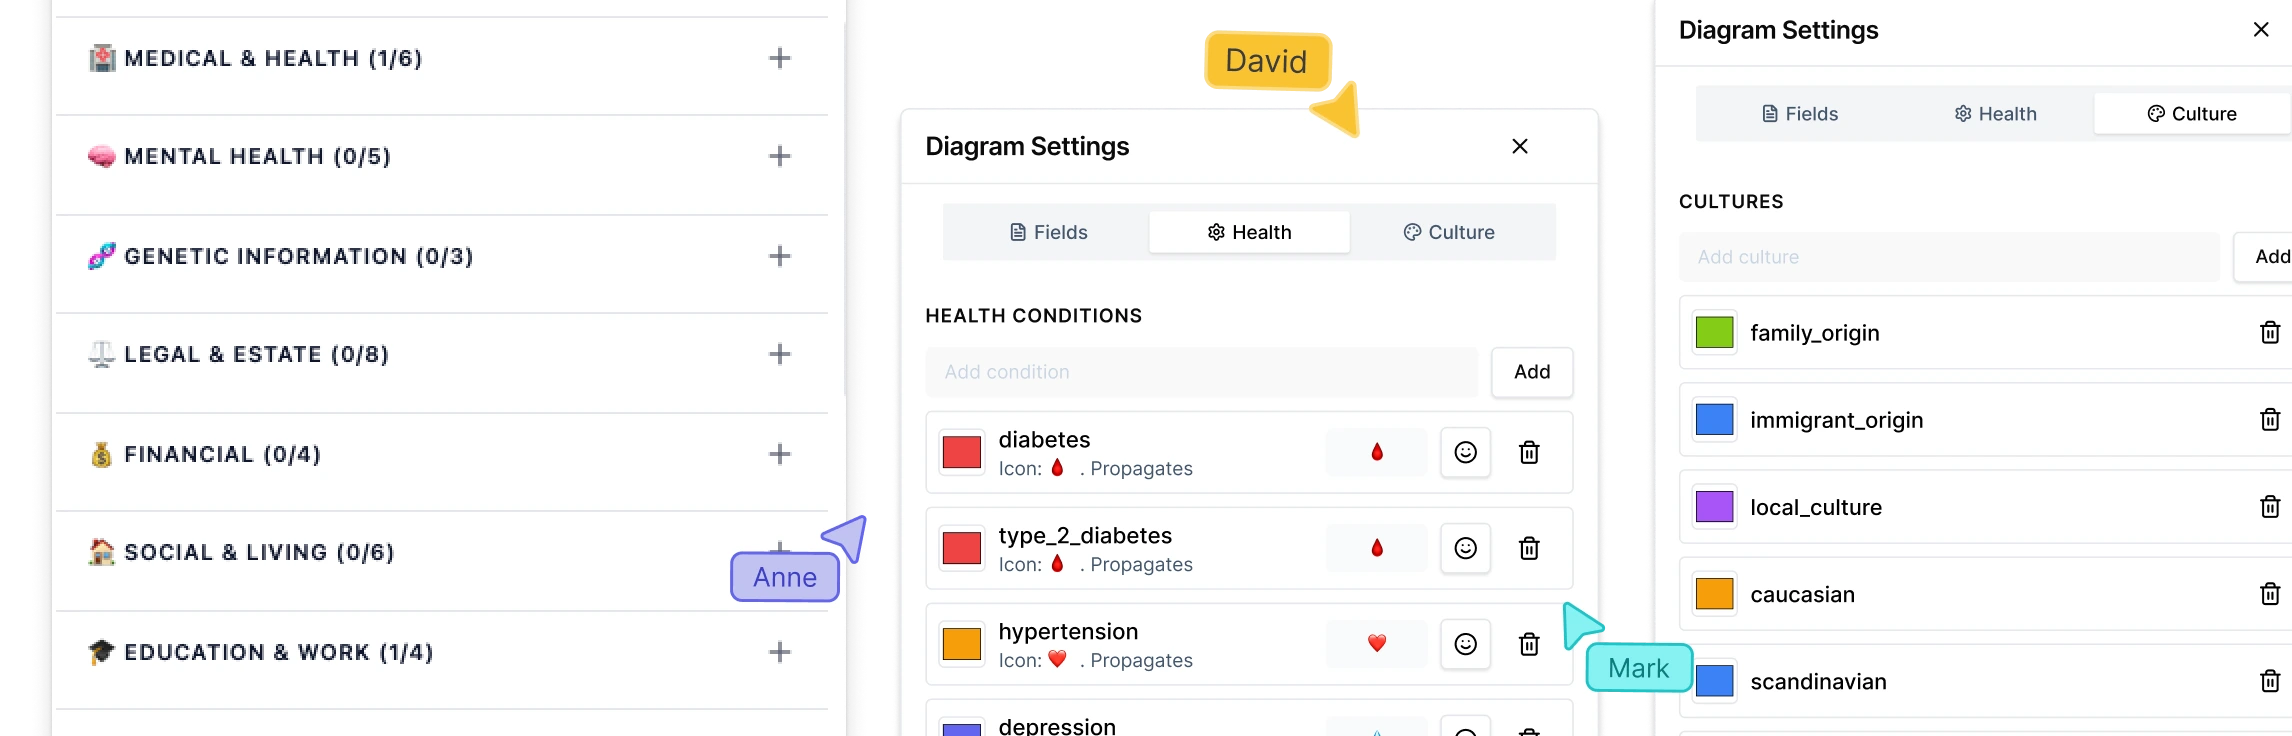
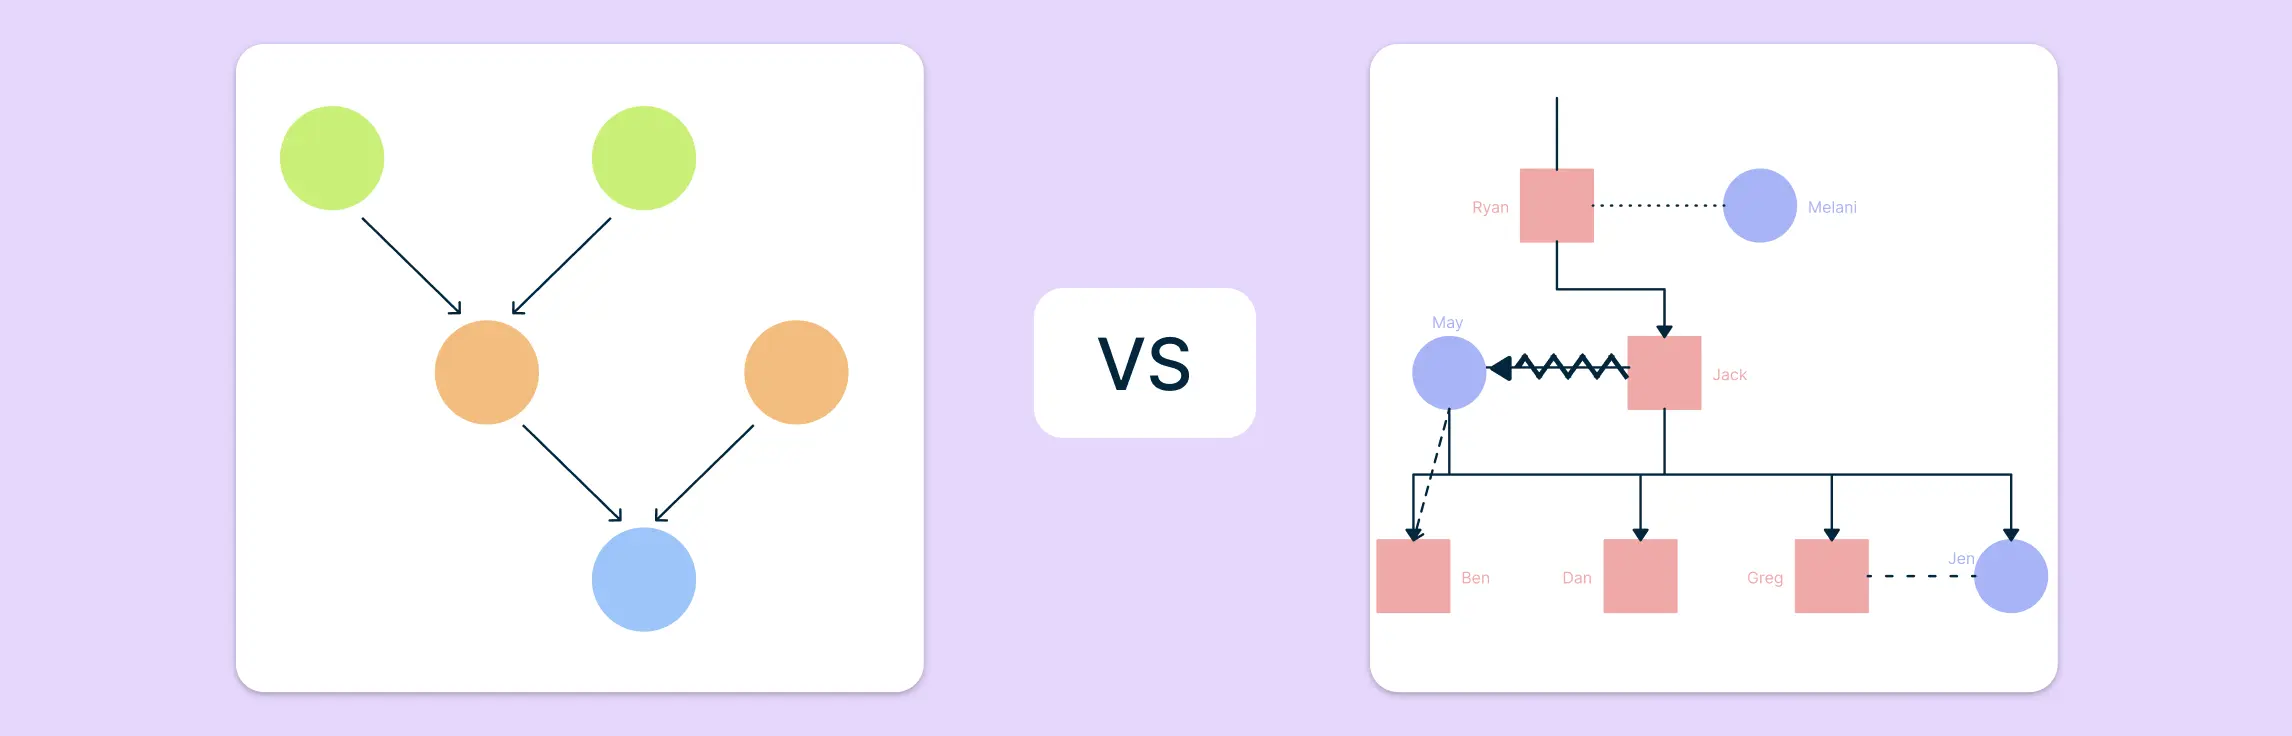
A genogram is a detailed, graphic representation of a family tree that not only outlines family relationships but also highlights patterns and dynamics within the family. Unlike traditional family trees, which primarily display lineage, genograms provide a comprehensive view of family interactions, health histories, and behavioral patterns, offering valuable insights into the familial influences that shape individual behaviors and health outcomes.
Free Genogram Templates


What Is a Family Tree?
A family tree is a diagram that represents the lineage and relationships among members of a family across multiple generations. It visually illustrates how individuals are connected, typically starting with a common ancestor at the base and branching out to show descendants. This tool is invaluable for understanding familial connections, tracing ancestry, and preserving family history.
Free Family Tree Templates


Comparison of Genogram vs Family Tree Diagrams
While both genograms and family trees serve to document family connections, they differ in several key aspects. Here’s a breakdown of the key features, benefits, and usage of genogram vs family tree diagrams.
Genogram vs Family Tree | ||
Genograms | Family Tree | |
Key Features |
|
|
Benefits |
|
|
When to Use |
|
|
How to Create Genograms and Family Tree Diagrams for Free in Creately
Creately offers intuitive tools to design detailed genograms and family tree diagrams, facilitating the visualization of familial relationships and histories. Below are step-by-step guides to help you create each diagram effectively.
Step 1. Access Creately
- Navigate to Creately and log in if you already have an account or sign up if you are a new user.
Step 2. Start a New Workspace
- Click on “Create New Workspace” to open a blank workspace.
Step 3. Start Building Your Diagram
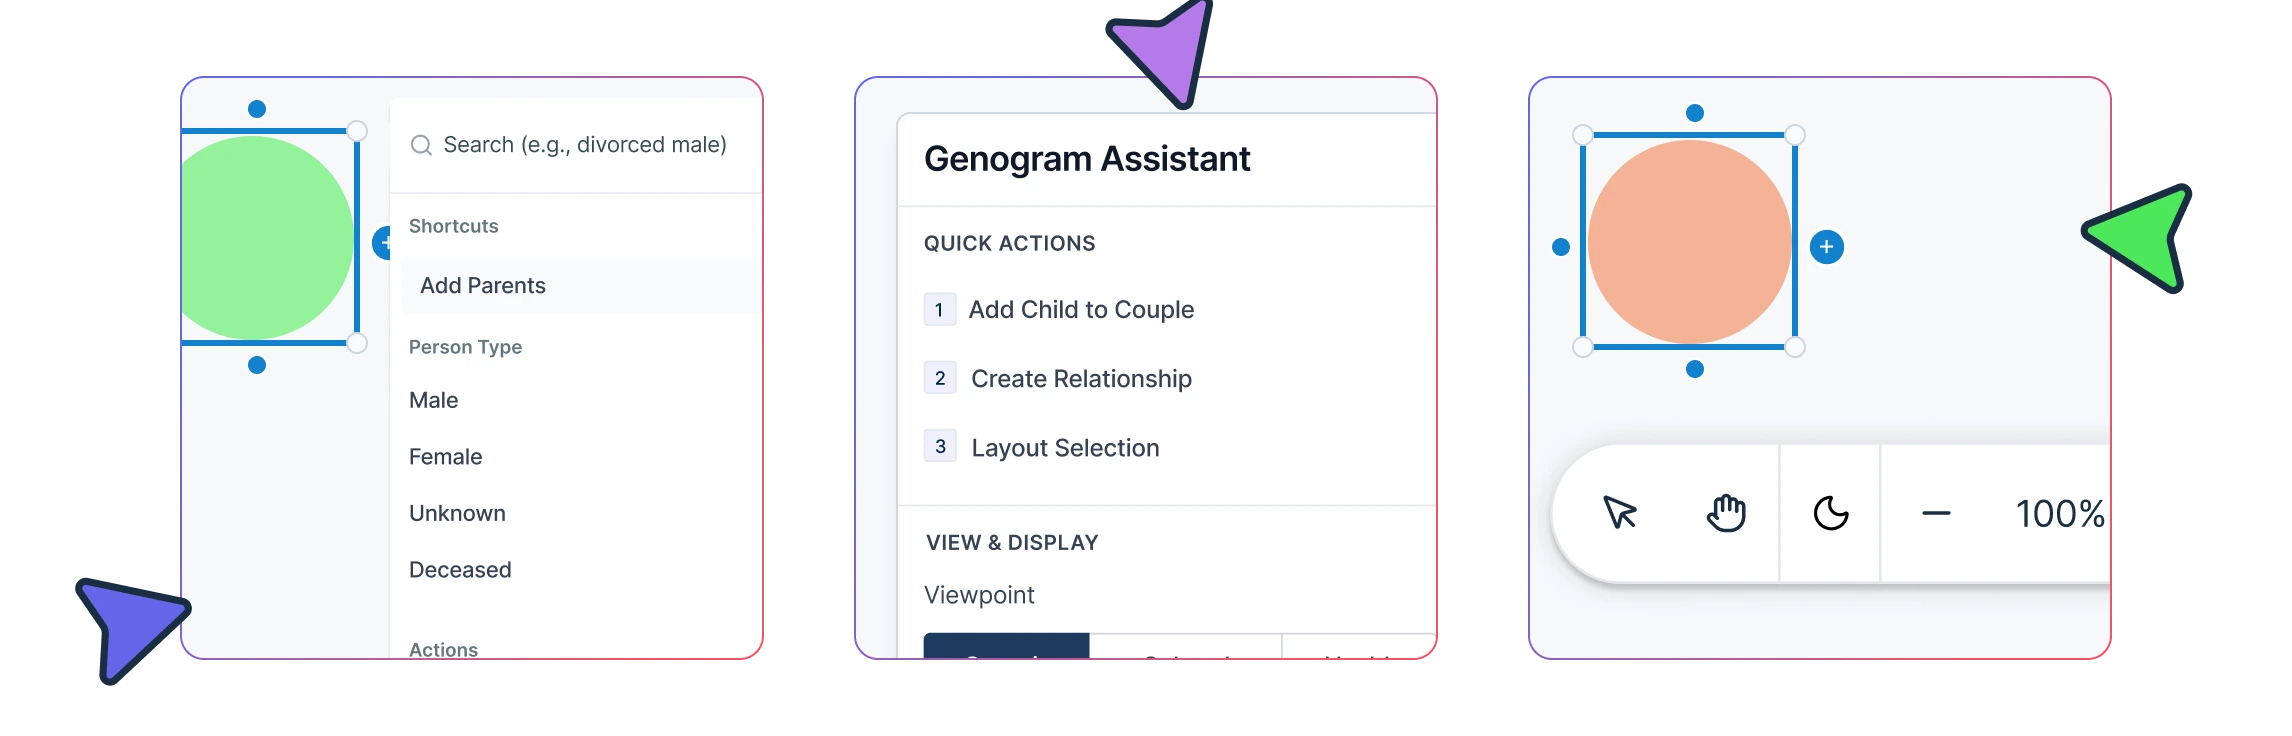
- Use the shape library to drag-and-drop shapes onto the canvas.
Step 4. Select a Template (Optional)
- Explore Creately’s genogram templates or family tree templates to find a suitable starting point for your diagram.
Step 5. Collect Detailed Family Data
- For family trees, collect essential details such as names, birthdates, and relationships of family members.
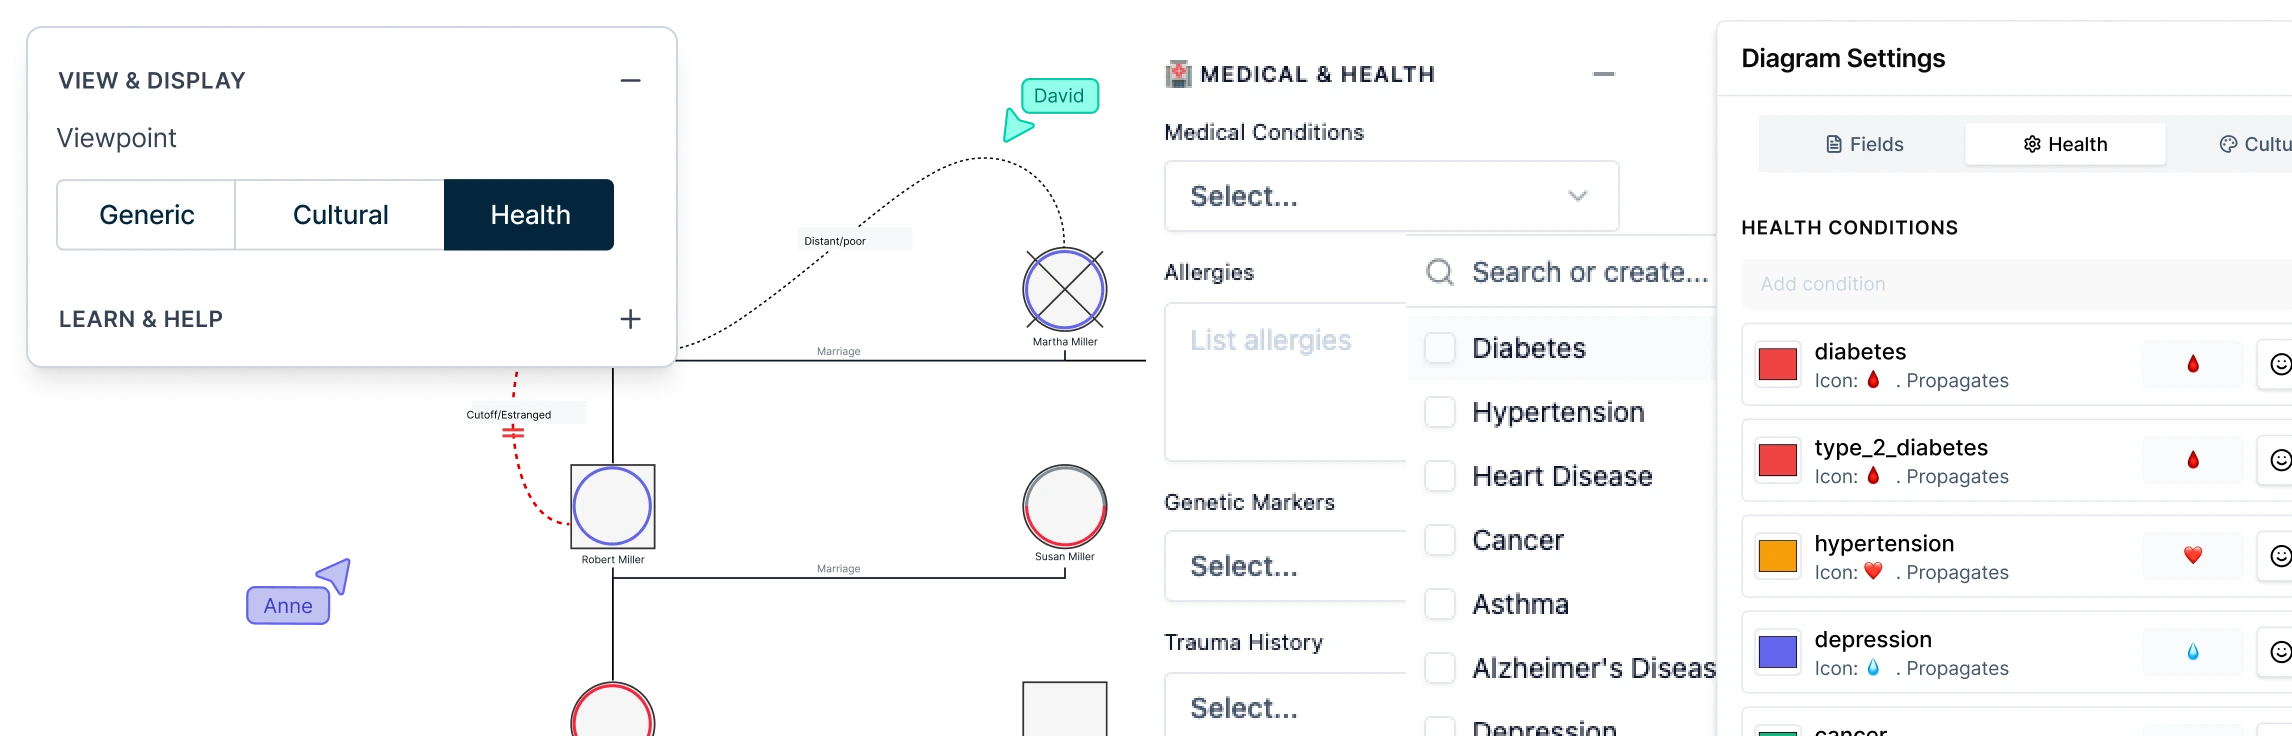
- Gather comprehensive information, including medical histories, and the nature of relationships among family members for genograms.
Step 6. Add Family Members Using Standard Symbols
- Use the shape library to drag and drop shapes representing family members onto the canvas.
- For genograms, add standardized shapes from the genogram shape library to represent individuals, ensuring consistency in symbol usage.
Step 7. Depict Relationships and Dynamics
- Use lines to link individuals, illustrating relationships like parent-child and marriages, and build the family tree hierarchy.
- In genograms, use specific lines and symbols to illustrate various relationship types, such as close, conflicted, or distant relationships, as well as medical conditions or behavioral patterns.
Step 8. Customize the Diagram
- Personalize the family tree by adjusting colors, fonts, and adding images to represent family members visually.
- Adjust the layout, colors, and fonts to enhance the clarity and visual appeal of the genogram.
Step 9. Analyze and Interpret
- Review the completed genogram to identify patterns, hereditary traits, or relational dynamics that may be significant for your analysis or records.
Step 10. Save and Share
- Save your diagram within Creately. Share it with relevant parties through a link or export it in various formats for documentation or presentation purposes.
By following these steps, you can effectively utilize Creately’s features to create comprehensive and visually engaging genogram and family tree diagrams, aiding in the exploration and documentation of familial histories and relationships.
Helpful Resources
Discover everything you need to know about genograms, from what they are, how to create a genogram, to how to understand what they mean.
Explore our collection of genogram templates.
Start visualizing your family tree and to create a richer, more engaging family history.
Discover various types of family tree templates.
Learn how different types of genograms can help visualize important aspects of life.
Explore the essential symbols used in genograms to represent everything from basic family structures to complex emotional and medical relationships.
FAQs About Genogram and Family Tree
How many generations can I include in a genogram or family tree?
How can creating a genogram or family tree benefit me?
Are there tools available to help create genograms or family trees?
Resources:
Butler, J.F. (2008). The Family Diagram and Genogram: Comparisons and Contrasts. The American Journal of Family Therapy, 36(3), pp.169–180. doi:https://doi.org/10.1080/01926180701291055.
Shapiro, F., Kaslow, F.W. and Maxfield, L. (2007). Handbook of EMDR and Family Therapy Processes. Wiley eBooks. doi:https://doi.org/10.1002/9781118269985.
Stagoll, B. and Lang, M. (1980). Climbing the Family Tree: Working with Genograms. Australian Journal of Family Therapy, 1(4), pp.161–170. doi:https://doi.org/10.1002/j.1467-8438.1980.tb00022.x.