The four main types—Spider Maps, Flowcharts, Hierarchy Maps, and System Maps—serve different purposes, from brainstorming to process mapping. This guide explores their structures, uses, and examples to help you choose the right one for your needs.
What Are the 4 Types of Concept Maps?
Concept maps are powerful visual tools that help structure information, making it easier to understand and analyze relationships between ideas. Depending on the purpose, different types of concept maps are used to represent knowledge in distinct ways.
The four most commonly used types of concept maps are:
- Spider Maps – Organize ideas around a central topic, making them ideal for brainstorming and idea generation.
- Flowcharts – Visually map out processes and workflows, showing step-by-step sequences for better decision-making.
- Hierarchy Maps – Represent structured relationships, commonly used for organizational charts and classification systems.
- System Maps – Illustrate complex systems by showing how different components interact with each other.
Each type has unique applications, and the following sections will explore them in detail, along with their best use cases.
4 Types of Concept Maps Explained
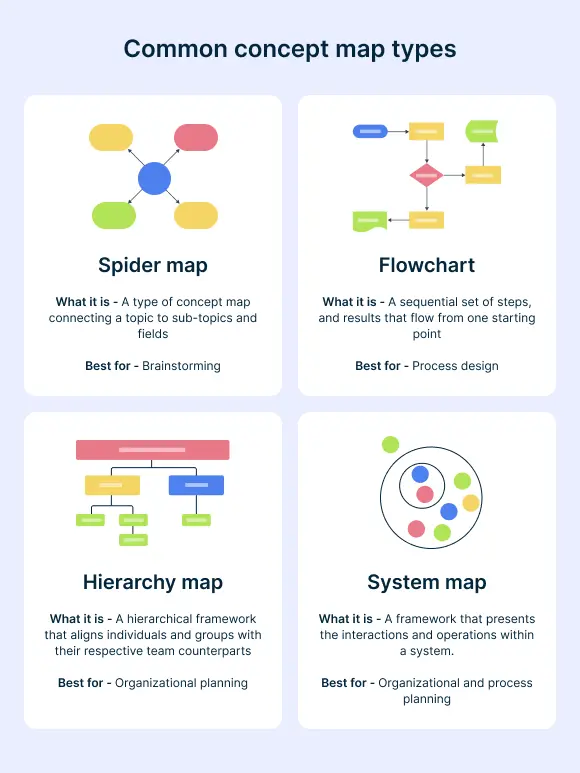
Type 1: Spider Maps - For Brainstorming and Organizing Ideas
Spider maps are a popular type of conceptual diagram that centers around a main idea or theme, with sub-themes radiating outward like the legs of a spider. This structure makes spider maps ideal for brainstorming sessions, note-taking, and organizing complex information by visually displaying the relationships between a central concept and its related ideas.
By visually connecting key concepts, spider maps help improve memory retention and understanding of complex subjects, making them particularly effective for both educational and professional purposes.
Key Features of Spider Maps:
- Central Topic at the Core: The main concept is placed at the center, providing a clear focal point.
- Branches Representing Related Ideas: Sub-themes and related topics branch out, showing how concepts are interconnected.
- Perfect for Brainstorming and Initial Exploration: Spider maps are excellent for quickly generating ideas and identifying connections during the early stages of planning or learning.


Type 2: Flowcharts - For Visualizing Process and Workflows
Flowcharts are a widely used type of concept map designed to represent processes, workflows, and decision-making paths. They consist of various shapes such as rectangles, diamonds, and ovals, each representing a specific action, process, or decision point. Directional arrows connect these shapes, indicating the flow and sequence of steps.
Flowcharts are particularly effective for outlining processes in a clear, sequential manner, making it easier to identify potential bottlenecks, inefficiencies, and opportunities for improvement. They play a crucial role in business process modeling, software development, and educational settings, where visual clarity facilitates better understanding and communication of procedures.
Key Features of Flowcharts:
- Step-by-Step Process Visualization: Clearly outlines each step, simplifying complex workflows.
- Directional Arrows for Flow and Sequence: Shows how different actions and decisions connect.
- Essential for Procedural Documentation: Ideal for creating process manuals, technical guides, and training materials.

Type 3: Hierarchy Maps - For Visualizing Organizational Structures
Hierarchy maps, also known as organizational charts, are a key type of concept map used to represent the structure of organizations, systems, or processes in a clear, tree-like format. They visually display relationships and relative ranks, starting from the highest level and branching down to lower levels.
These maps are essential for visualizing authority layers, decision-making processes, and reporting relationships within an organization. By providing a top-down view, hierarchy maps help both management and employees understand how roles and responsibilities are distributed, fostering better communication and collaboration.
Key Features of Hierarchy Maps:
- Top-Down Organizational Structure: Displays leadership levels and reporting lines clearly.
- Clear Depiction of Hierarchical Relationships: Helps teams understand roles, responsibilities, and decision-making flows.
- Ideal for Organizational Charts and System Hierarchies: Perfect for illustrating corporate structures, project teams, and system workflows.

Type 4: System Maps - For Analyzing Complex Systems
System maps are a powerful type of concept map that provides a comprehensive overview of system components and their interactions. They visually represent key elements such as stakeholders, processes, and resources, showing how these parts interrelate within a larger system.
These maps are essential in systems thinking, where understanding the dynamic interplay between components is crucial for problem-solving, strategic planning, and process optimization. System maps are widely used across industries, including urban planning, healthcare, education, and environmental management, offering deep insights into complex systems and helping to identify opportunities for improvement.
Key Features of System Maps:
- Displays Components and Their Interactions: Visualizes how stakeholders, processes, and resources connect.
- Essential for Complex Systems Analysis: Ideal for breaking down and understanding intricate systems.
- Supports Problem-Solving and Strategy Development: Helps identify issues and plan effective interventions.

Summary: Comparing Different Types of Concept Maps
| Type of Concept Map | Purpose | Structure | Best Use Case |
|---|---|---|---|
| Spider Map | Brainstorming ideas and exploring relationships | Central topic with sub-themes radiating outward | Ideal for brainstorming, note-taking, and idea generation. |
| Flowchart | Representing processes and workflows | Sequential flow with directional arrows and standard shapes (e.g., rectangles, diamonds, ovals) | Perfect for process documentation, software development, and business workflows. |
| Hierarchy Map | Visualizing organizational structure and ranks | Tree-like top-down structure showing hierarchical relationships | Best for organizational charts, system hierarchies, and decision-making processes. |
| System Map | Analyzing complex systems and their interactions | Network of interconnected components like stakeholders, processes, resources | Essential for systems thinking, strategic planning, and multi-factor problem-solving. |
Practical Uses of Concept Maps Across Different Industries
Concept maps are powerful tools used across various industries to simplify complex information, enhance understanding, and improve workflows. Here’s how concept maps are applied in key fields:
Concept Maps for Education
In educational settings, concept maps help break down complex subjects, making them easier for students to understand and remember. They link new knowledge with existing concepts, boosting comprehension and retention. Educators use concept maps to simplify challenging topics and encourage critical thinking.

Concept Maps for Business
For business professionals, concept maps streamline the organization of complex projects and strategic planning. They serve as visual aids during brainstorming sessions, helping teams map relationships between project components, identify dependencies, and enhance decision-making processes.

Concept Maps for Software Development
In software development, concept maps play a vital role in planning and visualizing software architectures. They outline system functionalities and illustrate interactions between components, leading to more efficient development cycles and smoother implementation processes.

Concept Maps for Healthcare
Healthcare professionals use concept maps to simplify patient education and staff training. By visually representing complex medical conditions and treatment plans, concept maps for healthcare improve patient understanding, enhance communication, and support better care outcomes.

Concept Maps for Research
Researchers rely on concept maps to structure, analyze, and interpret data. Concept mapping helps identify and visualize relationships between research variables, leading to deeper insights, clearer hypotheses, and more robust conclusions.
Helpful Resources
Explore how concept mapping is a dynamic and visual note-taking method that facilitates a deeper learning experience and enhances the retention of information.
Learn how to use concept maps in science education to organize and structure knowledge effectively to enhance scientific understanding and make complex information more accessible.
Discover what a career concept map is and its benefits, and explore ten templates to help you progress in your career
Learn how to create a concept map with ease using Creately
Key Benefits of Concept Mapping
Here are some key benefits of incorporating concept mapping into your processes:
Visual Representation: Concept maps transform dense and intricate data into clear visual structures, making it easier to absorb and retain information. This is particularly beneficial in settings where quick comprehension of complex subjects is crucial.
Understanding Relationships: One of the standout features of concept maps is their ability to clearly show how different concepts are interconnected. This aids in understanding dependencies and relationships between various elements of a project or study area.
Comparison and Contrast: Concept maps facilitate direct comparison and contrasting of ideas, which can be invaluable during decision-making processes or when trying to understand varying approaches to a problem.
Supports Development: By organizing knowledge visually, concept maps support educational and professional development, helping individuals and teams to think more clearly and communicate more effectively.
FAQs on Types of Concept Maps
What are the 5 elements of concept paper?
- Project Vision
- Project Scope
- Project Targets
- Timeline
- Milestones
- Project Management
How do I choose the right type of concept map?
Choosing the right concept map depends on your goals:
- Use Spider Maps for brainstorming ideas.
- Opt for Flowcharts when outlining processes.
- Select Hierarchy Maps to visualize organizational structures.
- Choose System Maps for analyzing complex systems.
Consider the complexity of information and how you want to represent relationships between concepts.
How can I create concept maps easily?
Can I combine different types of concept maps?
What is the type of concept map is best for studying?
Resources:
Eppler, M.J. (2006). A Comparison between Concept Maps, Mind Maps, Conceptual Diagrams, and Visual Metaphors as Complementary Tools for Knowledge Construction and Sharing. Information Visualization, 5(3), pp.202–210. doi:https://doi.org/10.1057/palgrave.ivs.9500131.
Schroeder, N.L., Nesbit, J.C., Anguiano, C.J. and Adesope, O.O. (2017). Studying and Constructing Concept Maps: a Meta-Analysis. Educational Psychology Review, 30(2), pp.431–455. doi:https://doi.org/10.1007/s10648-017-9403-9.