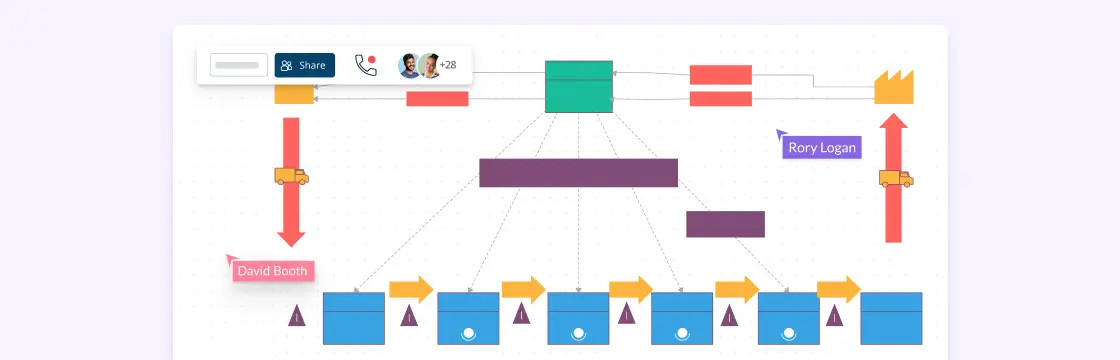
Value stream mapping (VSM) is a lean practice for visualizing the value-creating and non-value-creating activities required to deliver a product or service. A value stream map connects process flow with material or work-item flow, information flow, process data, and a timeline. Teams typically document the observed current state first and then design a feasible future state that improves the end-to-end flow.
These value stream mapping examples provide starting structures for manufacturing, software, supply-chain, service, and information-based value streams. Replace sample values with evidence gathered from the people who perform the work. Record the process or value-stream owner, responsible teams, handoffs, cycle time, lead time, inventory or queue levels, and other metrics relevant to the selected value stream.
Examples of Value Stream Maps
These value stream mapping templates include conventional current-state and future-state maps as well as adapted visual layouts. Select an example whose scope and flow resemble the value stream you need to study, then open it in Creately’s value stream mapping tool. Confirm that the symbols and metrics used in the finished map follow your team’s lean conventions.
Customize the map with observed process data and identify the accountable value-stream or process owner. Notes, links, files, and contextual comments can keep supporting evidence and review discussions connected to relevant parts of the map. Link current- and future-state maps so readers can navigate between them. Review and maintain each source map as the value stream changes.
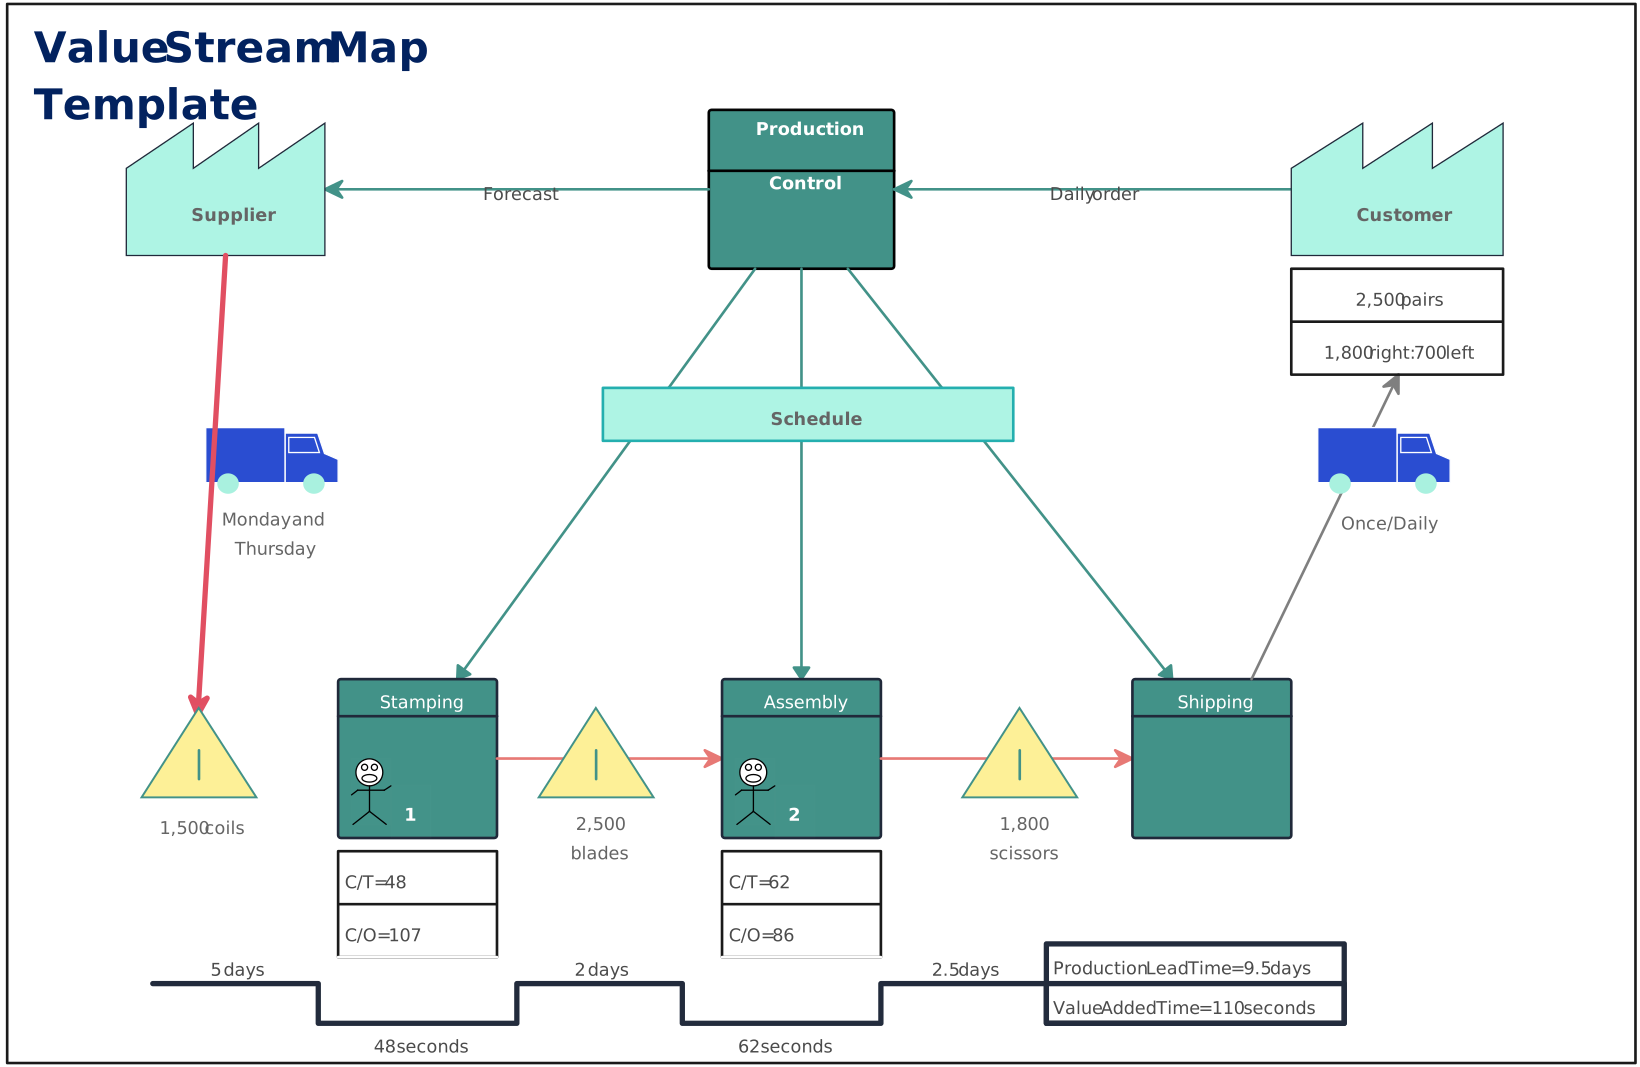
1. Production Control Value Stream Map
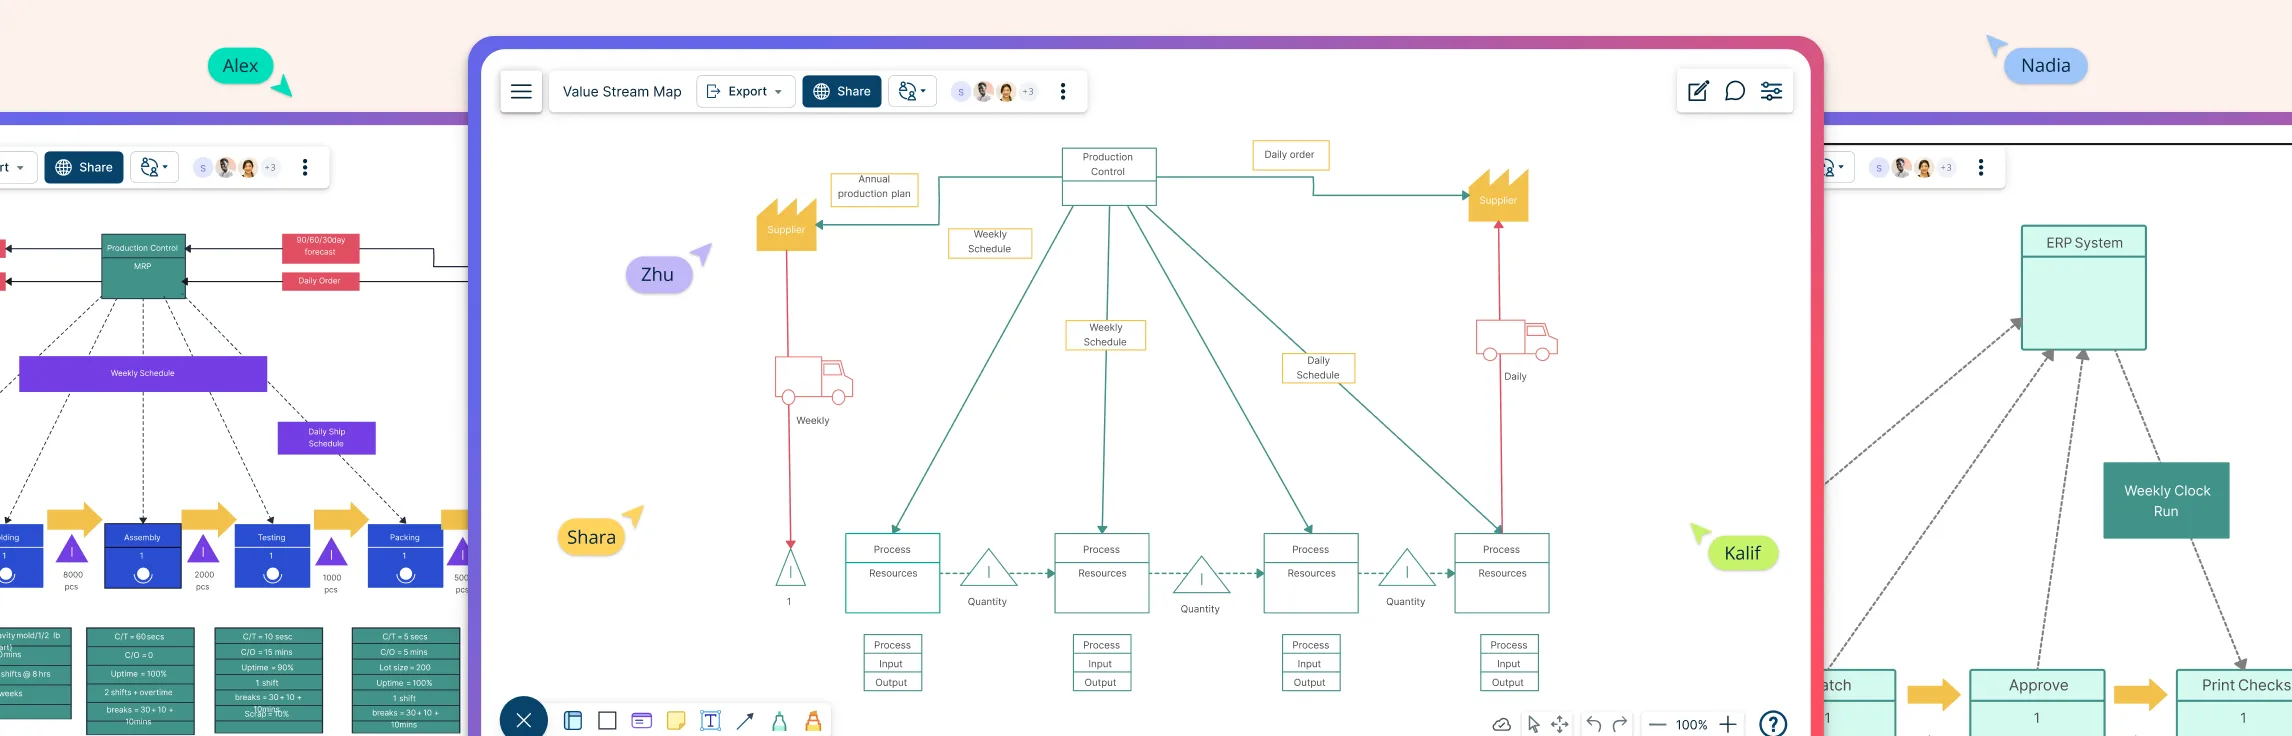
This value stream mapping example shows how materials and information flow from suppliers to customers. Use it to spot delays, bottlenecks, and improvement opportunities—click to customize it in Creately.

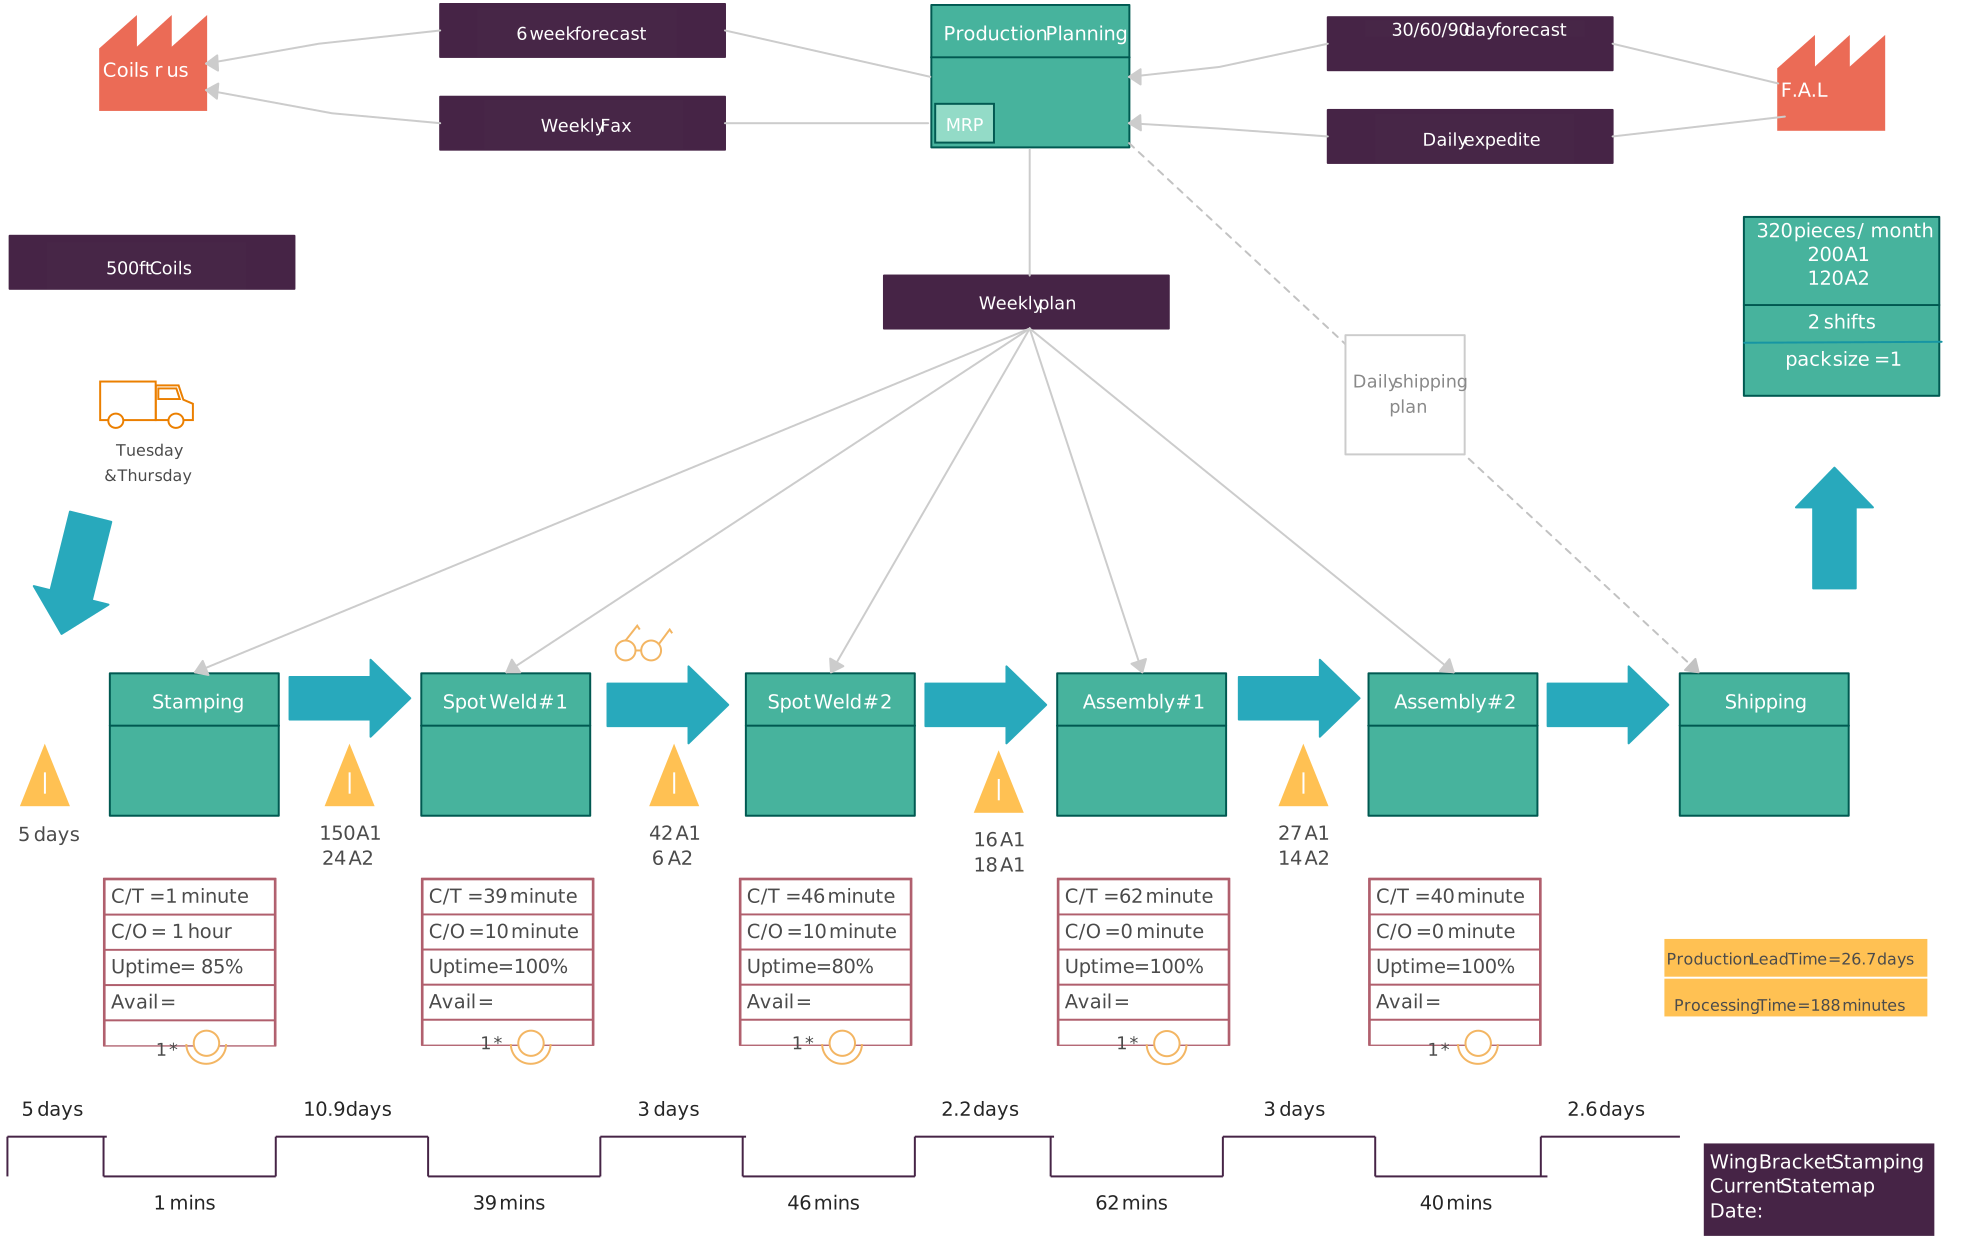
2. Current State Value Stream Map
This current-state value stream map is based on a Toyota Production System example. Use it to record how material and information actually flow today, including process steps, queues, cycle times, changeover times, and lead time. The validated current state provides the evidence needed to design a future-state map. Use the value stream mapping guide to review the recommended mapping sequence and metrics.
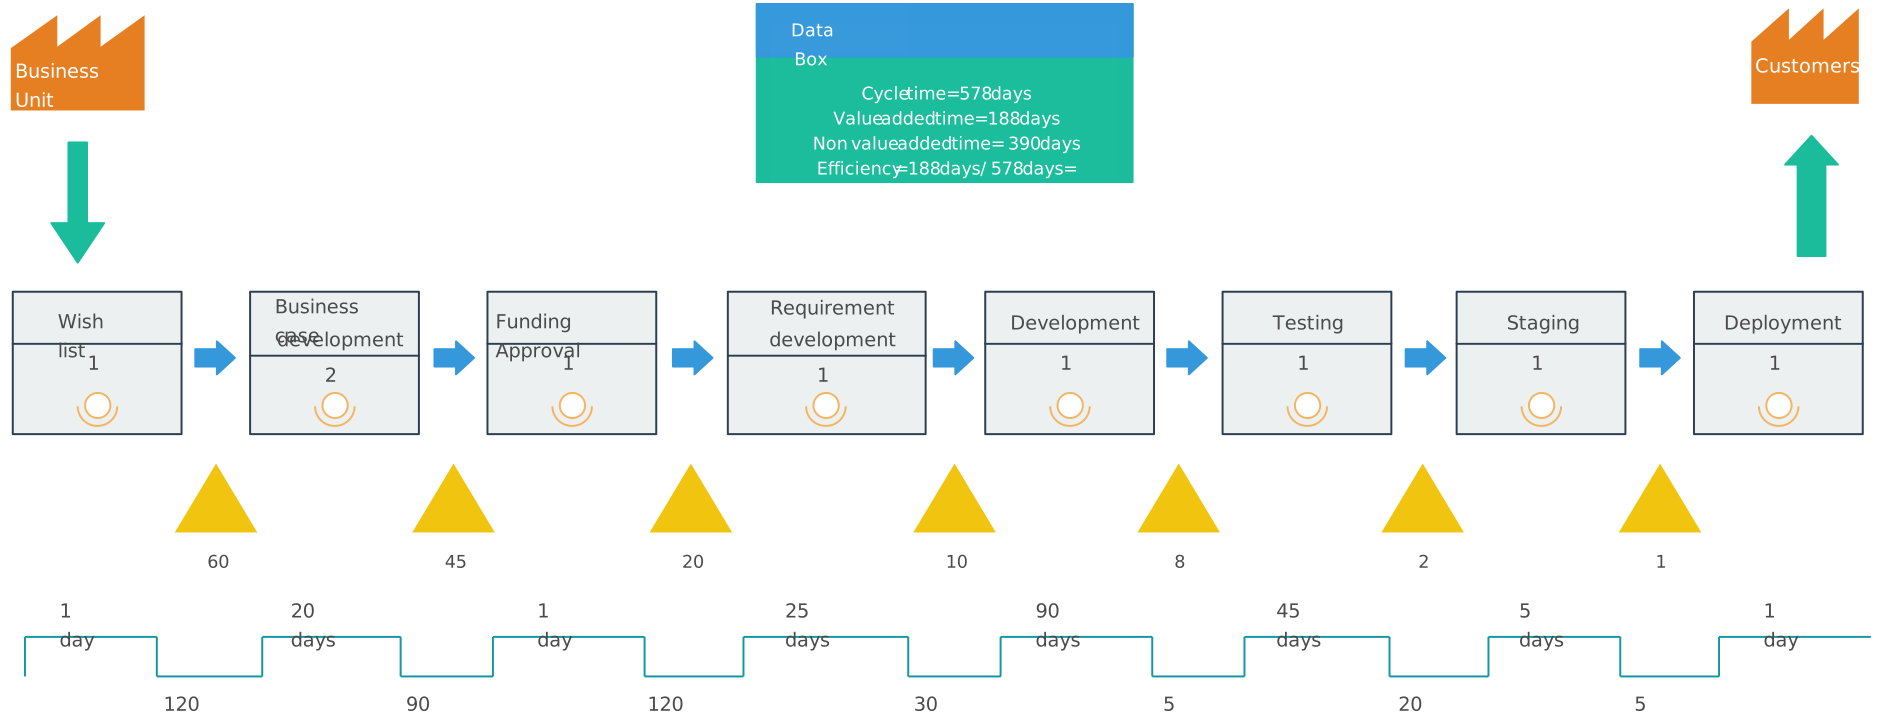
3. Value Stream Map for Software Development Process
This example adapts value stream mapping to software development, from a request or requirement through delivery. Use work items in place of physical material, distinguish active work from waiting time, and record handoffs, queues, rework, and lead time across the delivery flow.
4. Funnel Shaped Value Stream Model
This manufacturing example presents the value stream in a funnel-shaped layout. Treat the layout as a visual variation rather than evidence of a particular demand or throughput pattern. Validate its process boxes, information flow, data boxes, inventories, and timeline against the real current state before using it for improvement decisions.
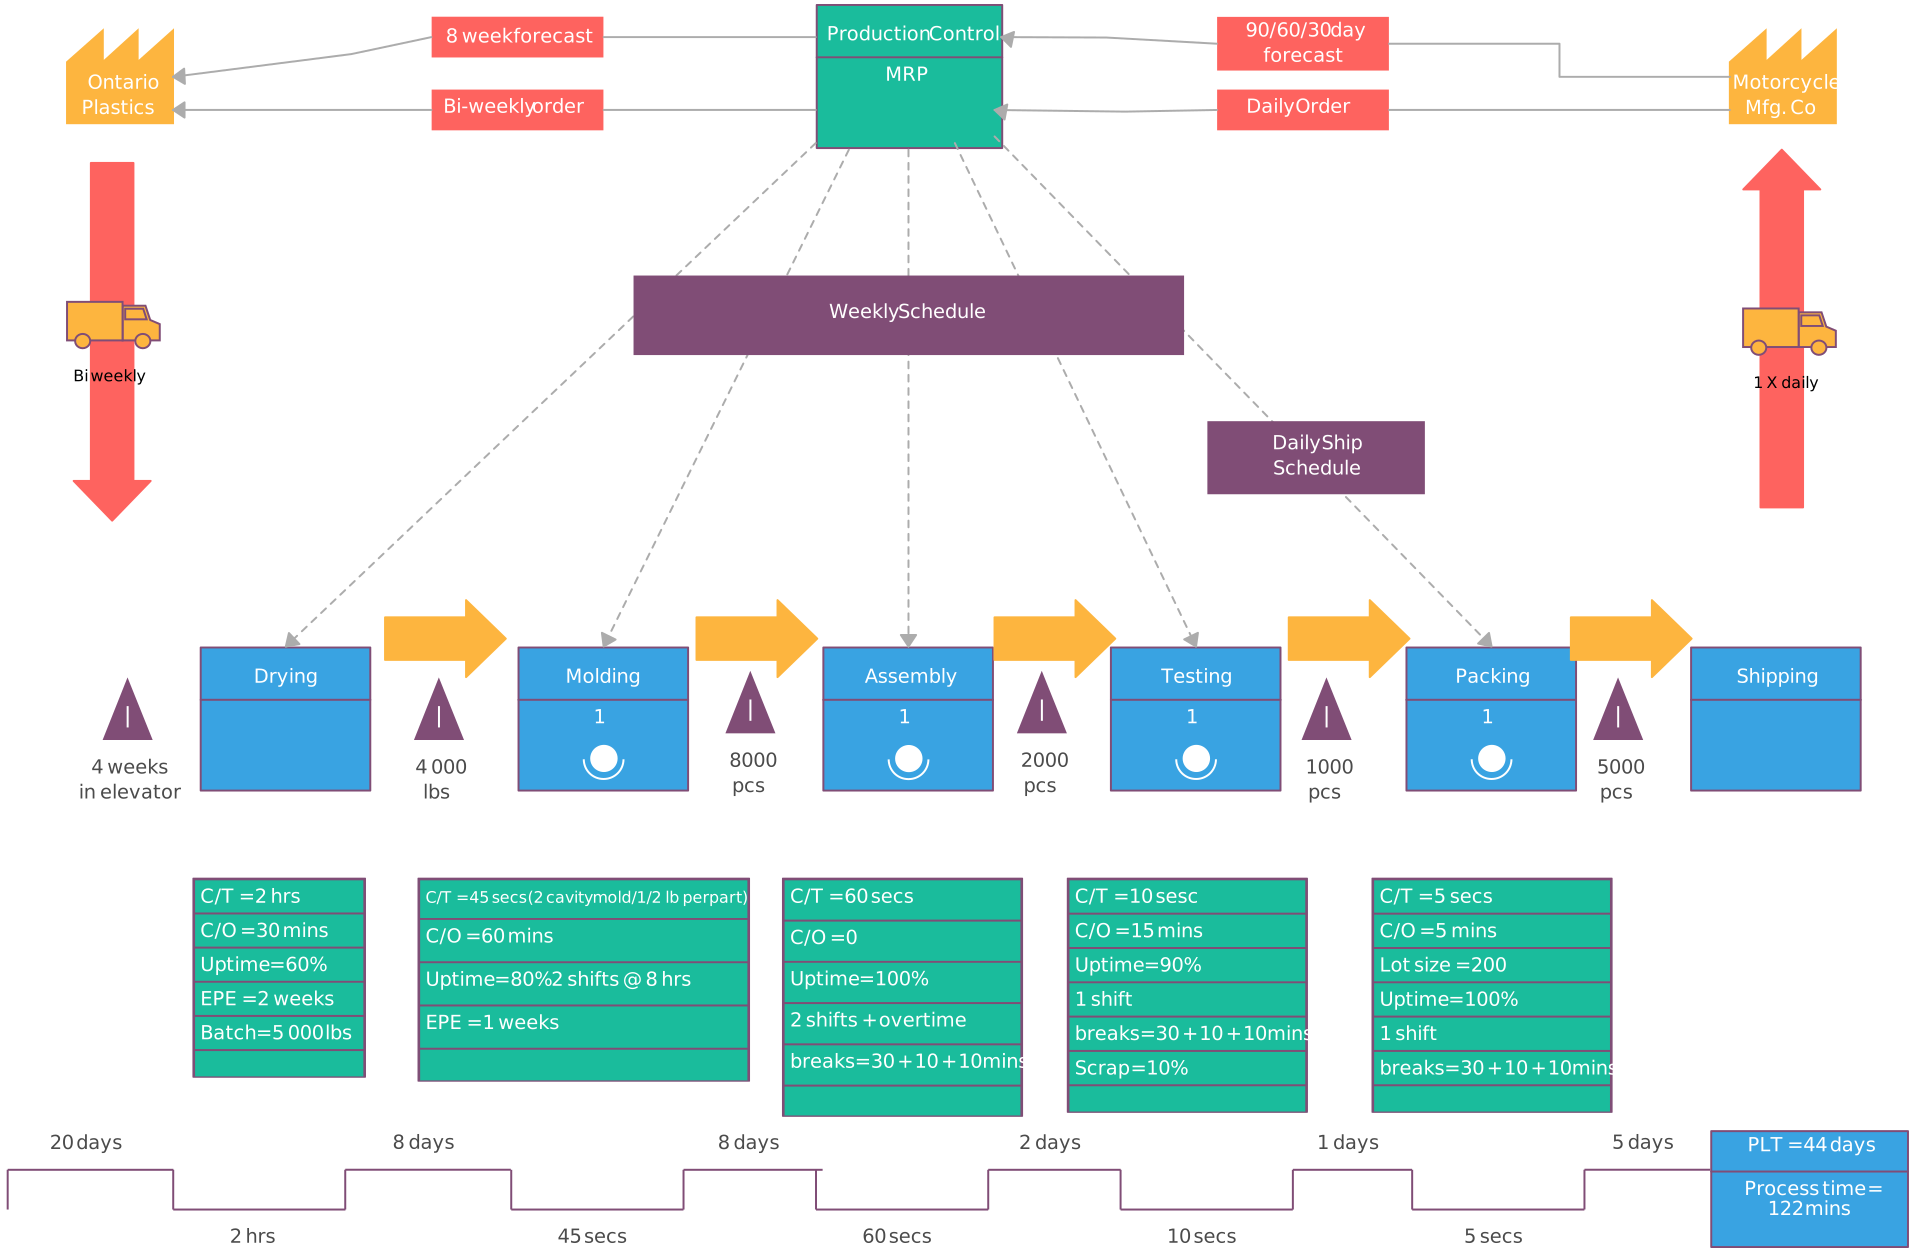
5. Value Stream Map for Supply Chain Management
This example helps visualize the flow of materials, information, and processes across the supply chain. Use it to spot inefficiencies, delays, and improvement opportunities.
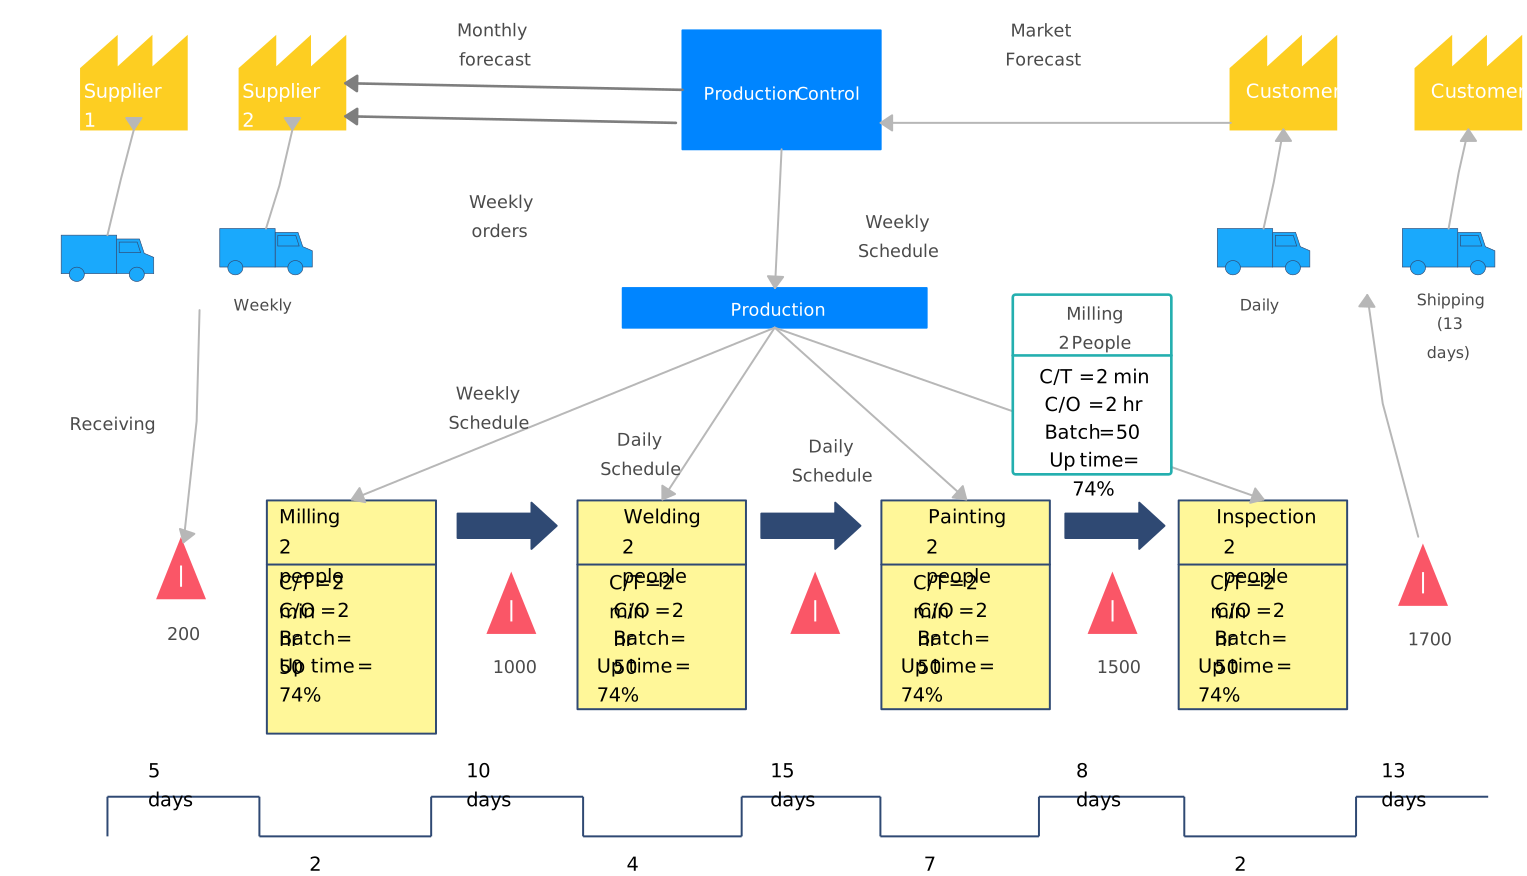
6. Pyramid Shaped Value Stream Map
This pyramid-shaped current-state example represents an accounts-payable value stream. Adapt it by mapping how invoices or payment requests move, where information is reviewed, how long work waits, and where rework or handoff delays occur. The pyramid layout itself does not indicate whether inputs or outputs are large or small.
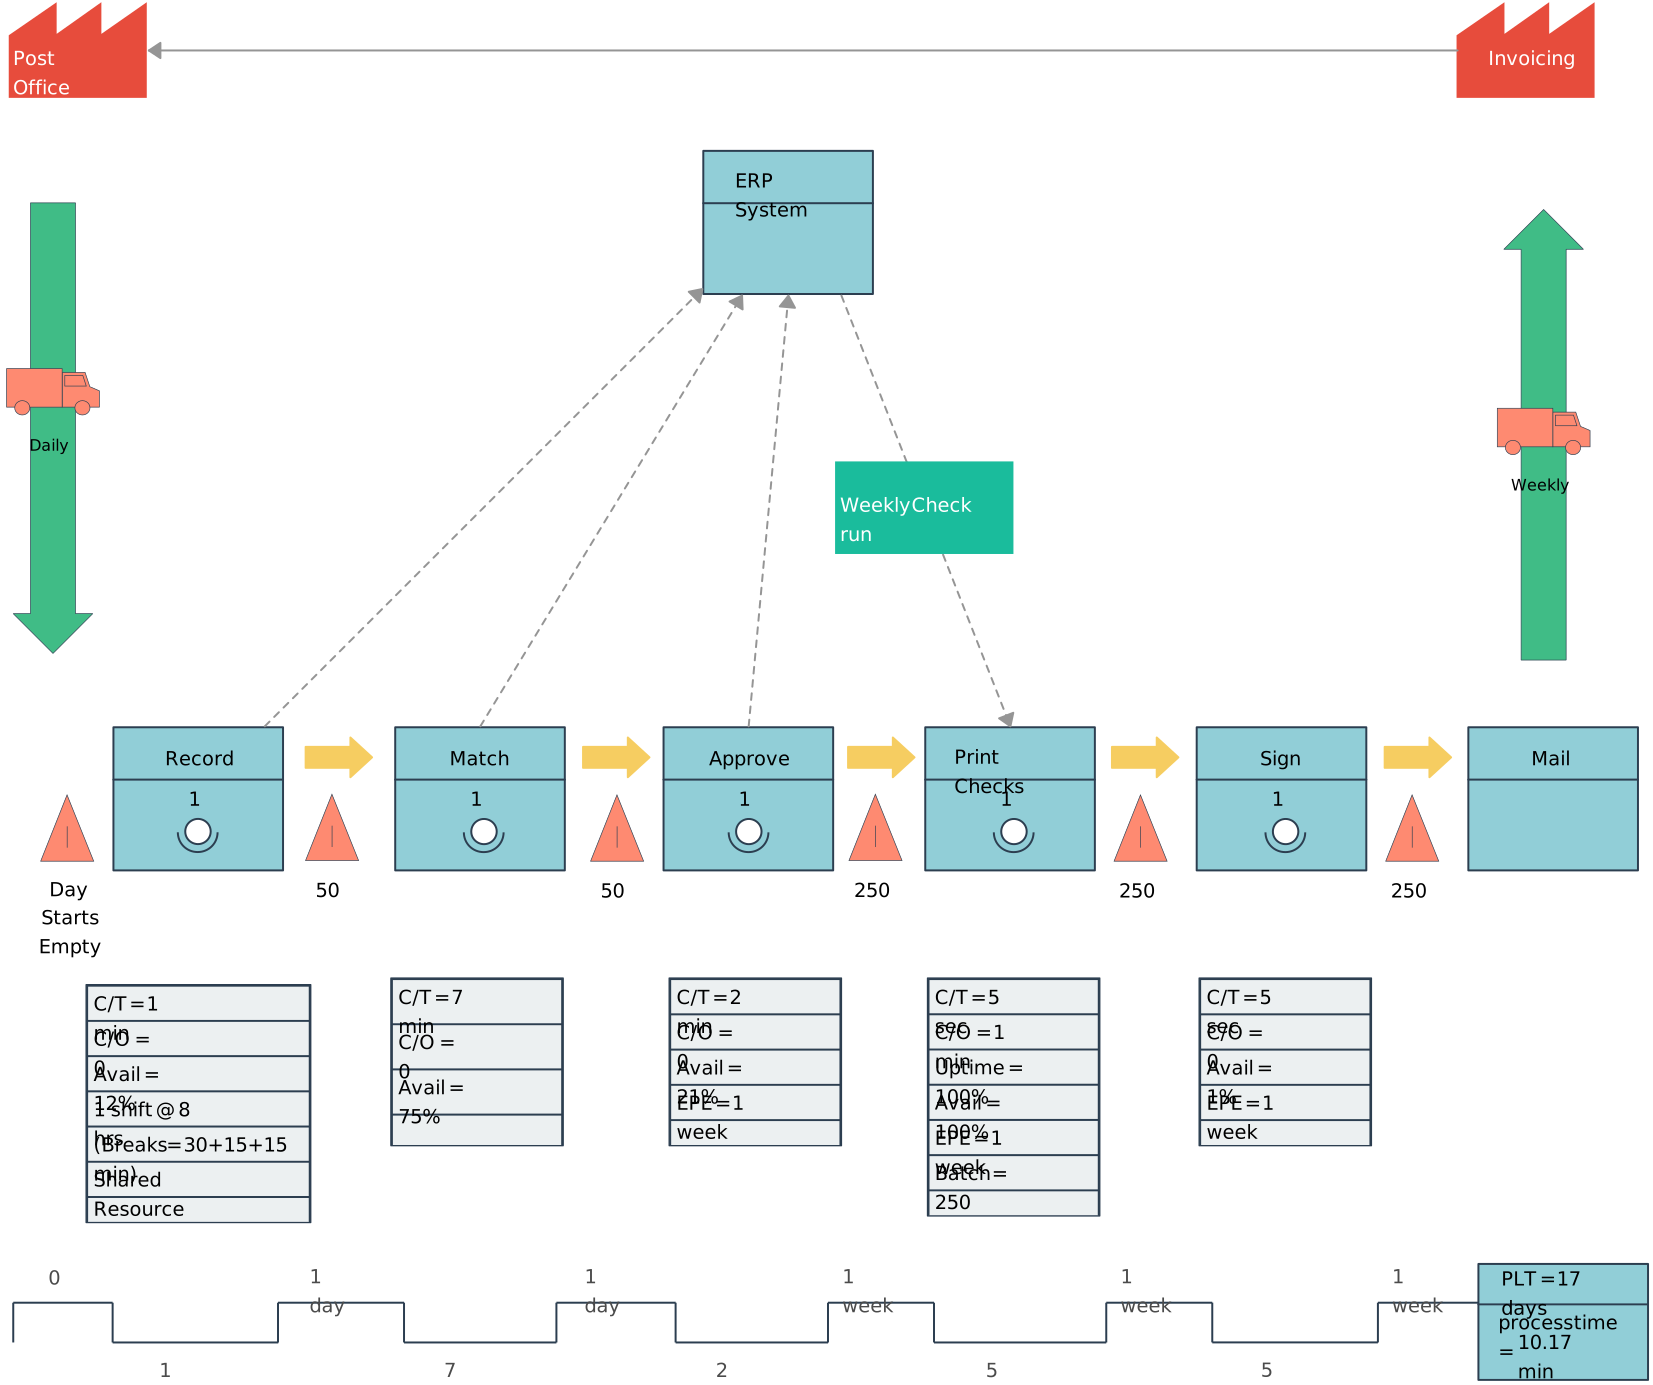
7. Value Stream Map for Data Management
This example can be adapted to a data-management value stream by treating requests, datasets, or information products as the work item. Map intake, validation, transformation, review, delivery, queues, and rework, then add cycle and lead times based on observed data.
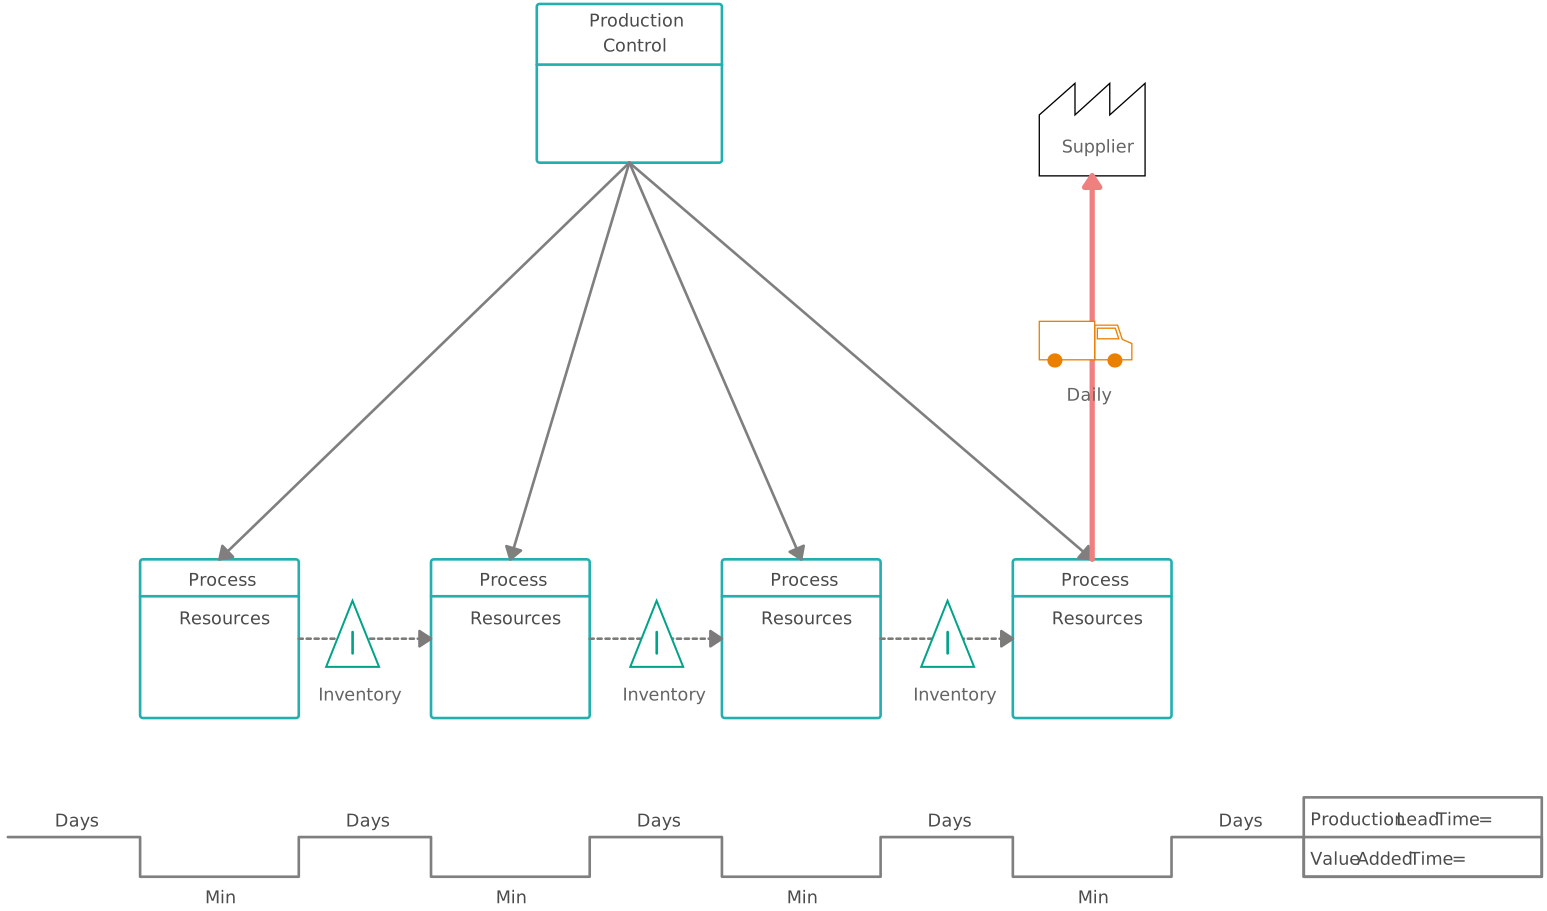
8. Future State Value Stream Map
This example shows a target future state based on findings from a current-state map. Use it to visualize a feasible flow with reduced waiting, inventory, rework, or unnecessary handoffs. Keep the assumptions and improvement context connected to the map, and revise the target when evidence changes.
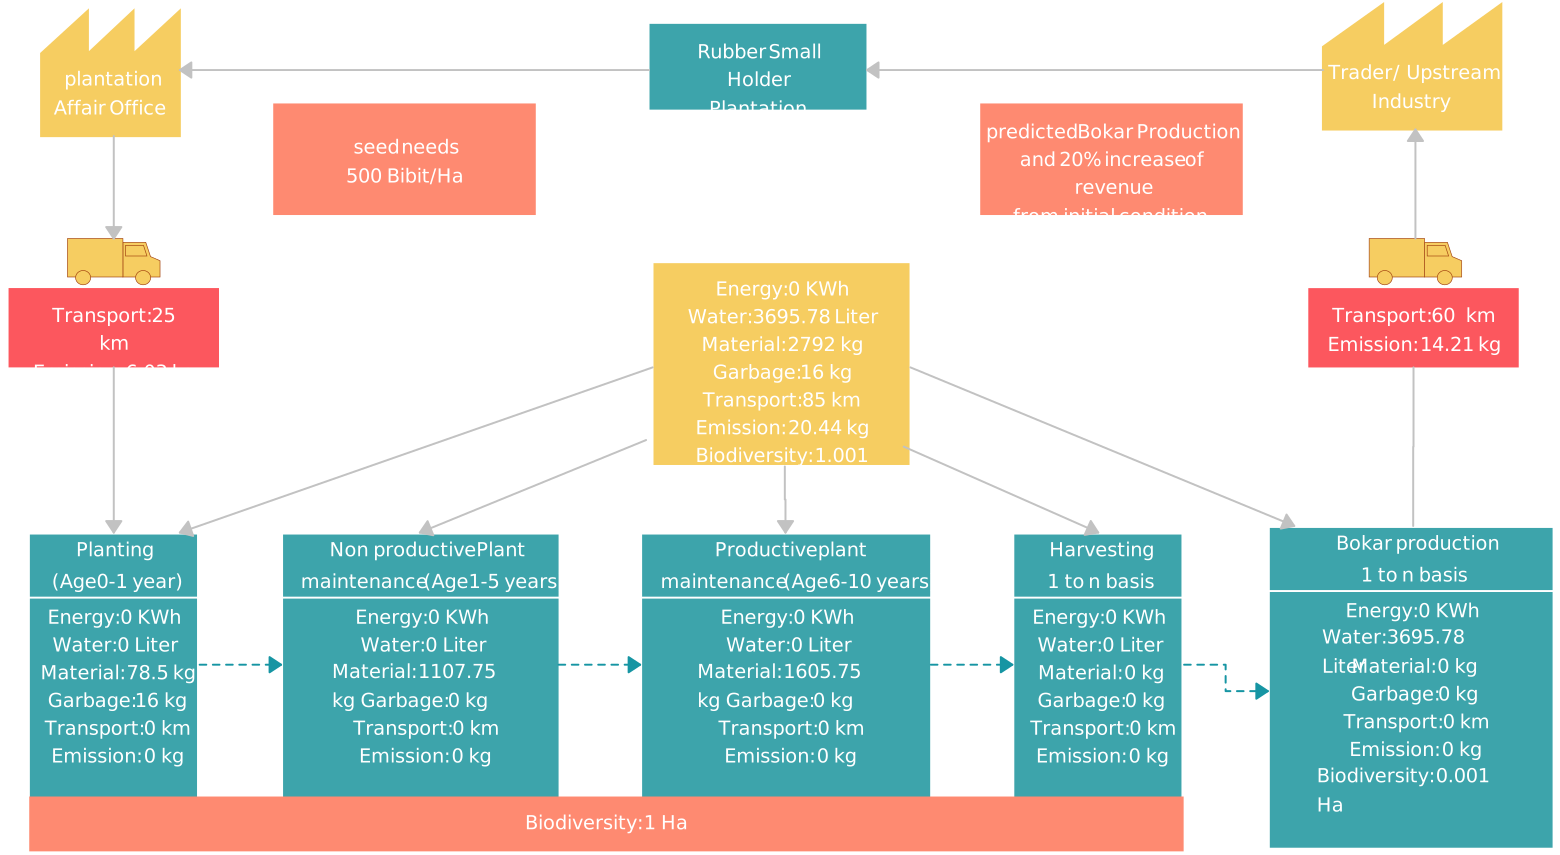
9. Pipe Shaped Value Stream Map
This pipe-shaped example represents a machine-shop value stream for producing mold components. Use it as a current-state starting point and replace its process data with observations from the actual flow. The layout does not mean that the process is already streamlined.
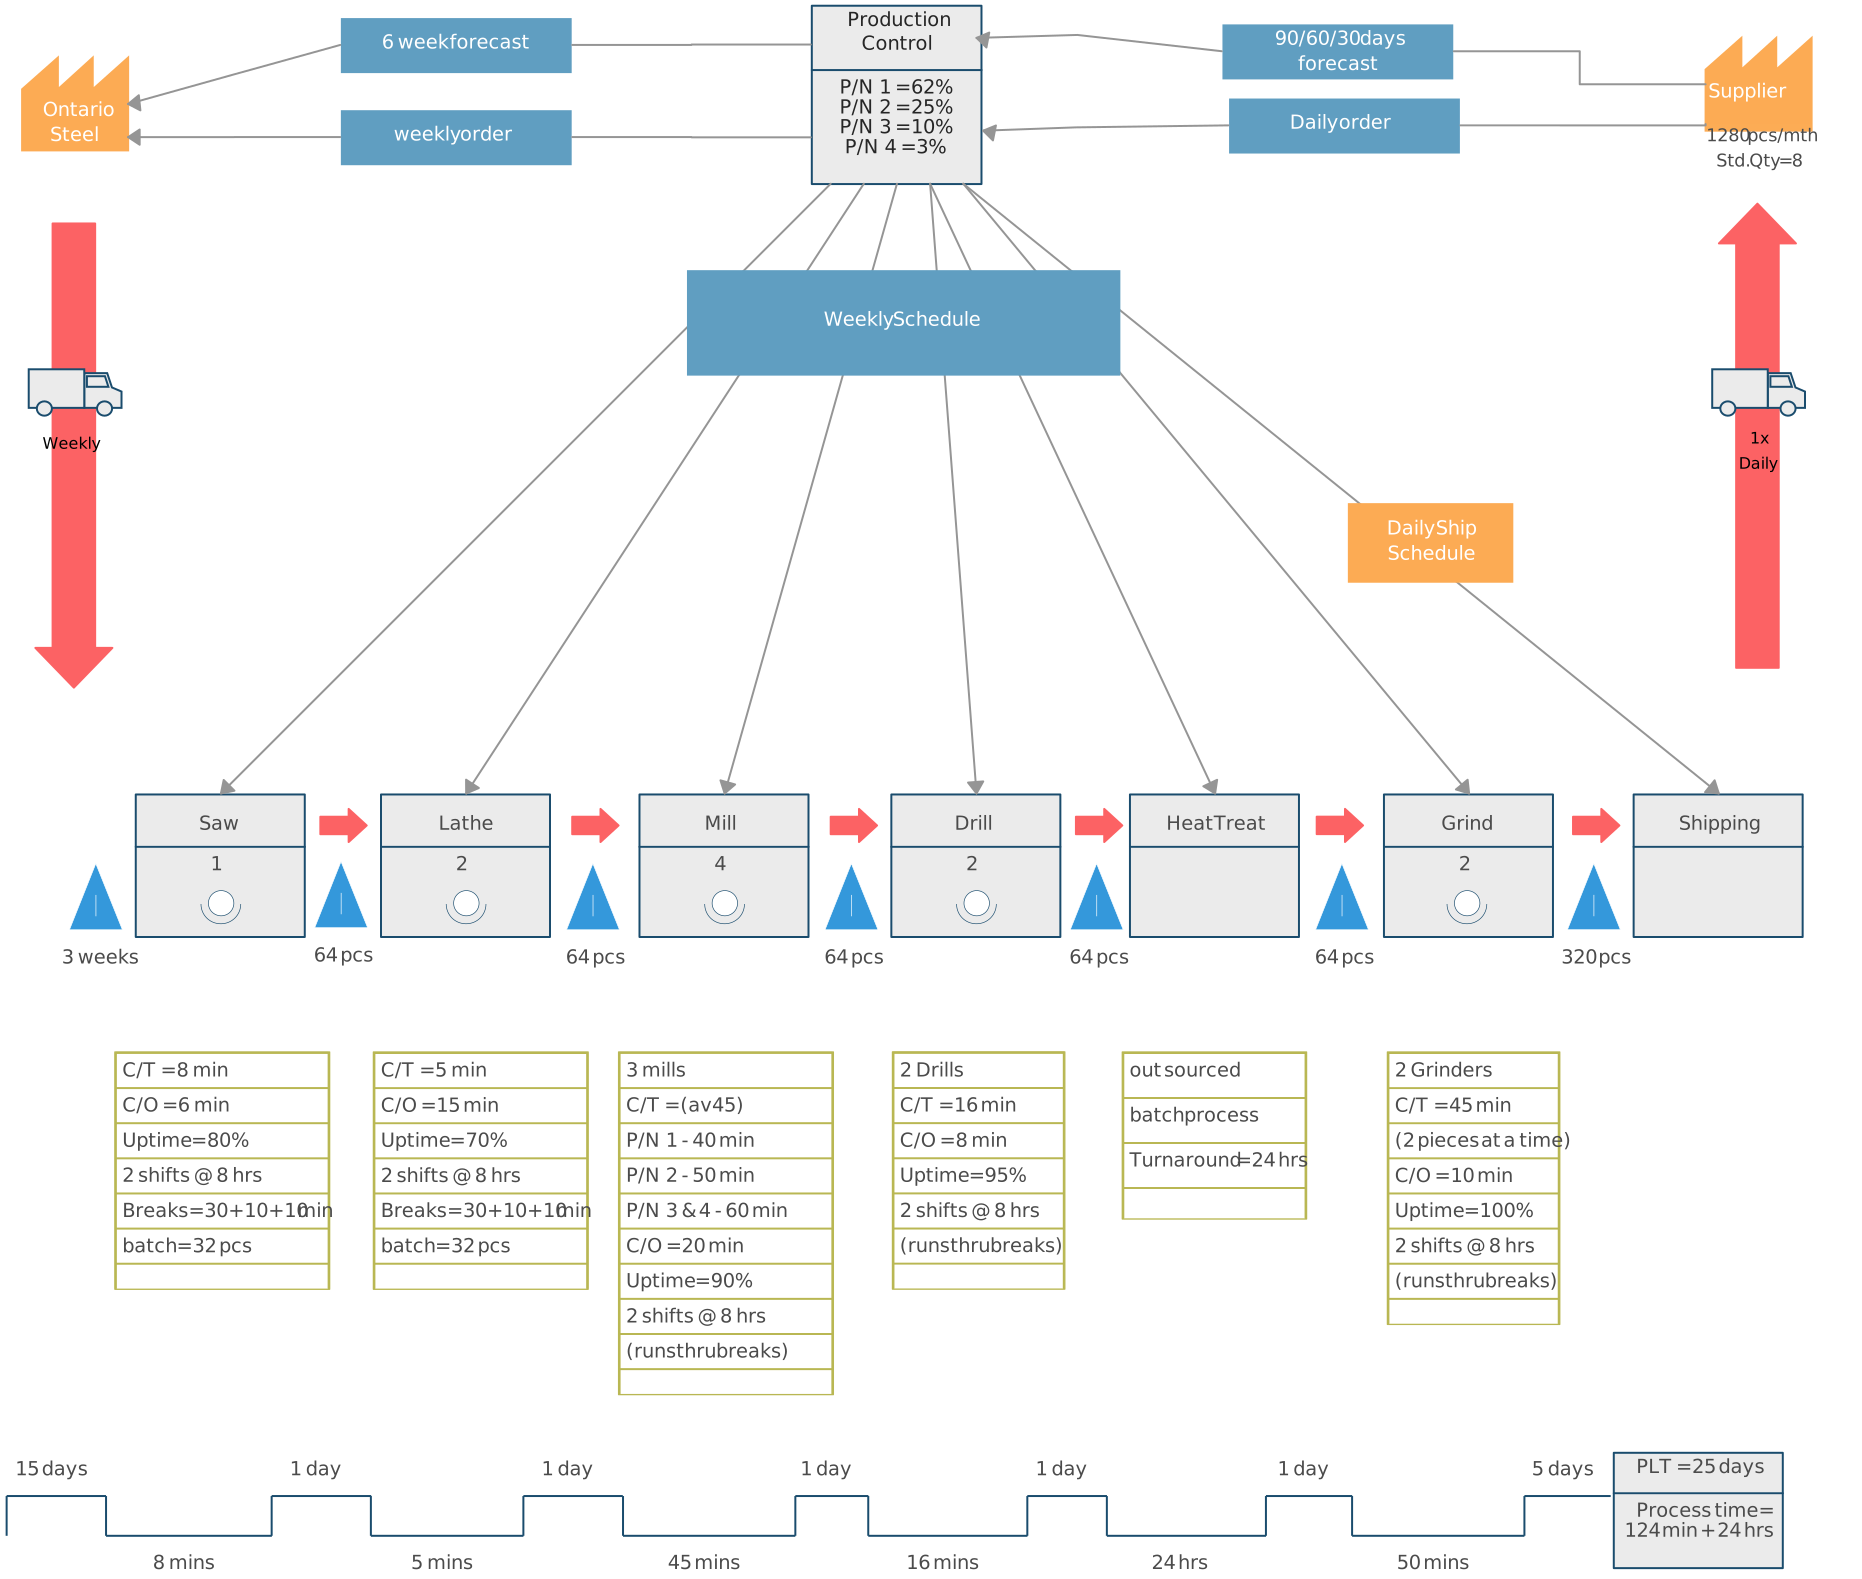
10. Process Cartoon Value Stream Map
This example uses the familiar current-state style associated with Learning to See, sometimes described as a process cartoon. It brings process steps, information flow, material or work-item flow, data boxes, and the timeline into a shared view for cross-functional analysis.
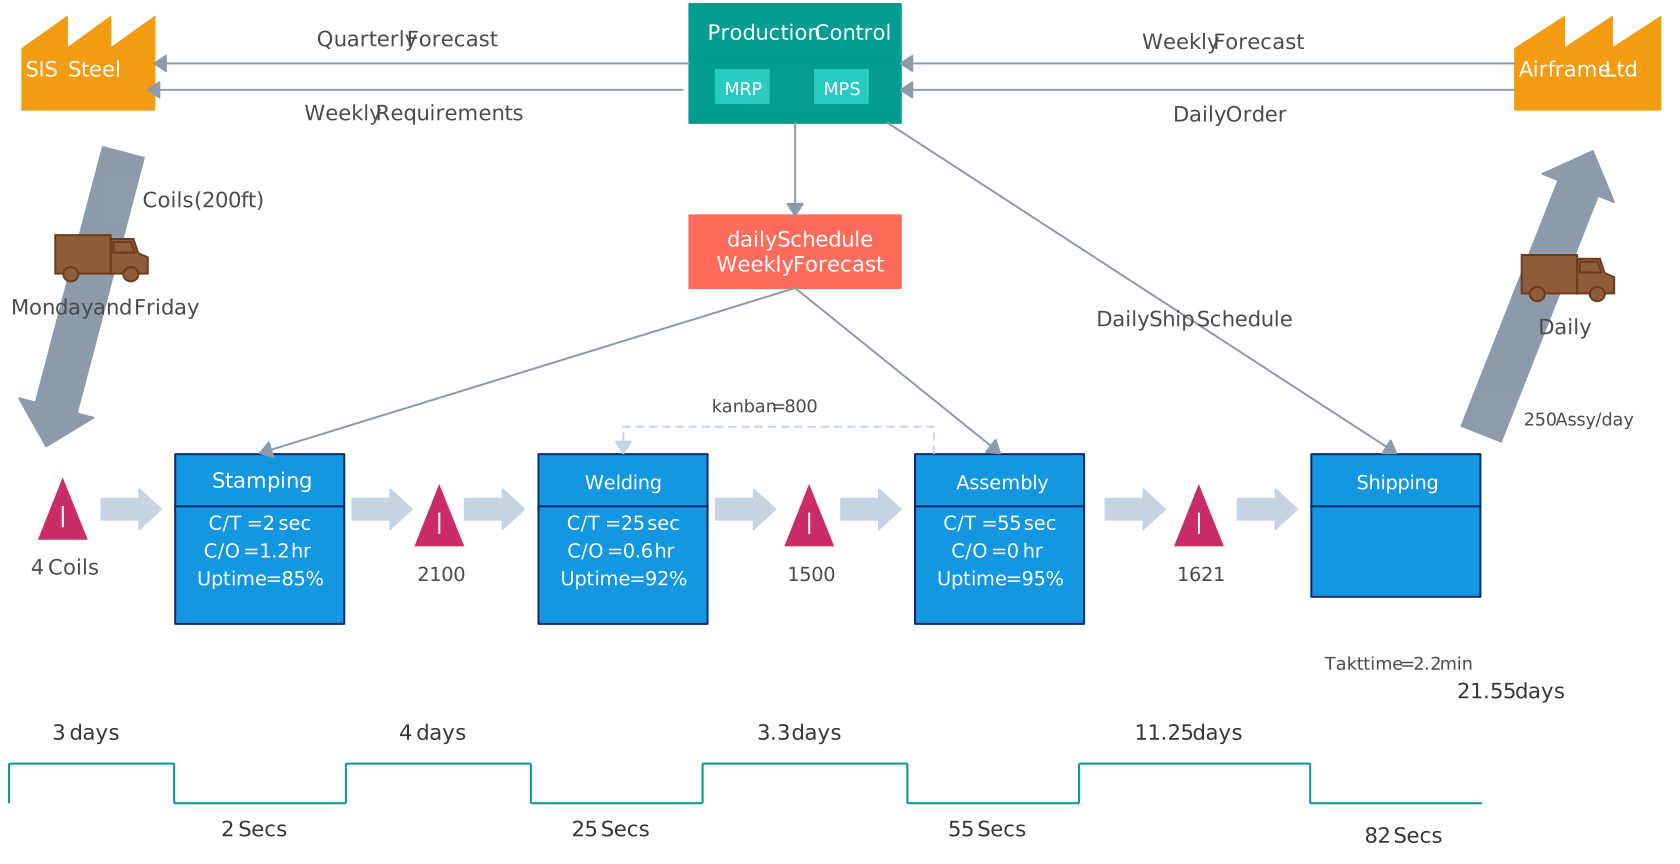
Use these examples as workshop aids rather than finished answers. Build the current state with a cross-functional team, validate it where the work happens, and document the customer, supplier, scope, process family, and measurement period. After stakeholders review the map, the accountable owner can incorporate corrections and maintain the source as living documentation. Record future-state assumptions and improvement priorities in connected notes or reference material, and use that context during implementation and follow-up reviews.