A process flow diagram (PFD) visually maps out the steps in a process from start to finish using standard symbols. It helps teams understand, analyze, and improve workflows across fields like engineering, business, and software. This guide explains what a PFD is, its main components, key symbols, and why it’s useful.
Process Flow Diagram Definition
A process flow diagram (PFD) is a type of diagram commonly used in the industrial and engineering fields to represent the major components of a process and their relationships. It visually displays the flow of materials, actions, or operations within a system, helping to document, analyze, and improve processes. PFDs are primarily used in chemical, mechanical, and process engineering, although their principles can be applied to any field requiring process documentation.
Typically, a PFD uses standardized symbols to represent equipment like pumps, vessels, or compressors, and lines to depict the flow of materials or information between these components. Arrows indicate the direction of the flow, while labels often provide important operational details (e.g., temperature or pressure).
Key Components of a Process Flow Diagram
A process flow diagram includes key components that visually represent a process. These components ensure clarity, efficiency, and consistency. The main elements of a PFD include:
1. Major equipment
- Includes machinery like pumps, compressors, mixers, boilers, and vessels.
- Each piece of equipment is labeled with an identifier.
2. Process piping
- Shows how fluids or gases move between equipment.
- Pipes are represented with lines connecting different components.
3. Flow direction
- Arrows indicate the movement of materials through the process.
- Ensures clarity in understanding how the process operates.
4. Control valves and process-critical valves
- Regulate flow, pressure, and temperature within the system.
- Essential for process safety and efficiency.
5. Operational data
- Includes key parameters like temperature, pressure, and flow rate.
- Helps in monitoring and optimizing process conditions.
6. Process stream names and composition
- Identifies the type of material flowing through different stages.
- Useful for understanding chemical reactions or production steps.
7. Connections with other systems
- Shows how the process integrates with external systems or subsystems.
- Important for large-scale industrial operations.
How to Make a Process Flow Diagram
Follow these steps to create an effective and accurate process flow diagram that communicates information clearly.
Step 1. Define the process: Clarify what you’re mapping—an existing workflow, a new system, or an area for improvement. Set clear start and end points and consult with stakeholders to gather details.
Step 2. Identify key components: List essential elements: equipment (like pumps or tanks), materials (inputs/outputs), and actions (mixing, heating, etc.).
Step 3. Use standard symbols: Stick to ANSI or ISO standards for clarity—ovals for start/end, rectangles for steps, diamonds for decisions, arrows for flow.
Step 4. Map the flow: Layout steps in logical order and connect them with arrows. Keep related components grouped for clarity.
Step 5. Add details: Label everything clearly. Include relevant data like temperature or pressure where needed. Show inputs and outputs at each step.
Step 6. Review and refine: Double-check for accuracy and flow. Get feedback from your team and simplify where possible to keep the diagram clear and useful.
Process Flow Diagram Symbols
Process flow diagram symbols follow international standards (such as ISO and ANSI) but may vary slightly between industries. Using the right symbols ensures clear communication, process efficiency, and easier troubleshooting.
Chemical and process engineering symbols: These represent core elements like reactors, separators, and mixers. They help engineers show how raw materials are transformed during a chemical process.
Heating equipment symbols: Used to illustrate devices like heaters, boilers, and furnaces. These symbols show how heat is applied to support reactions or processing steps.
Industrial equipment symbols: These cover a wide range of machinery used in manufacturing—such as conveyors, mills, or dryers—essential for depicting physical processes.
Instruments symbols: These symbols indicate control devices like sensors, indicators, transmitters, and controllers. They help track pressure, flow, temperature, and more within a system.
Pumps symbols: Pumps move liquids or gases through the system. Different types (centrifugal, diaphragm, etc.) have specific symbols to represent how materials flow.
Valves and fittings symbols: These show how flow is controlled, blocked, or redirected. Valve symbols are key to understanding how fluids are managed at various process stages.
Vessels symbols: These include tanks, columns, and containers that store or process fluids. They’re vital for showing capacity, containment, and reaction stages.
Process annotation symbols: Used for adding extra information, like notes or references, without cluttering the main diagram. They help clarify complex steps or conditions.
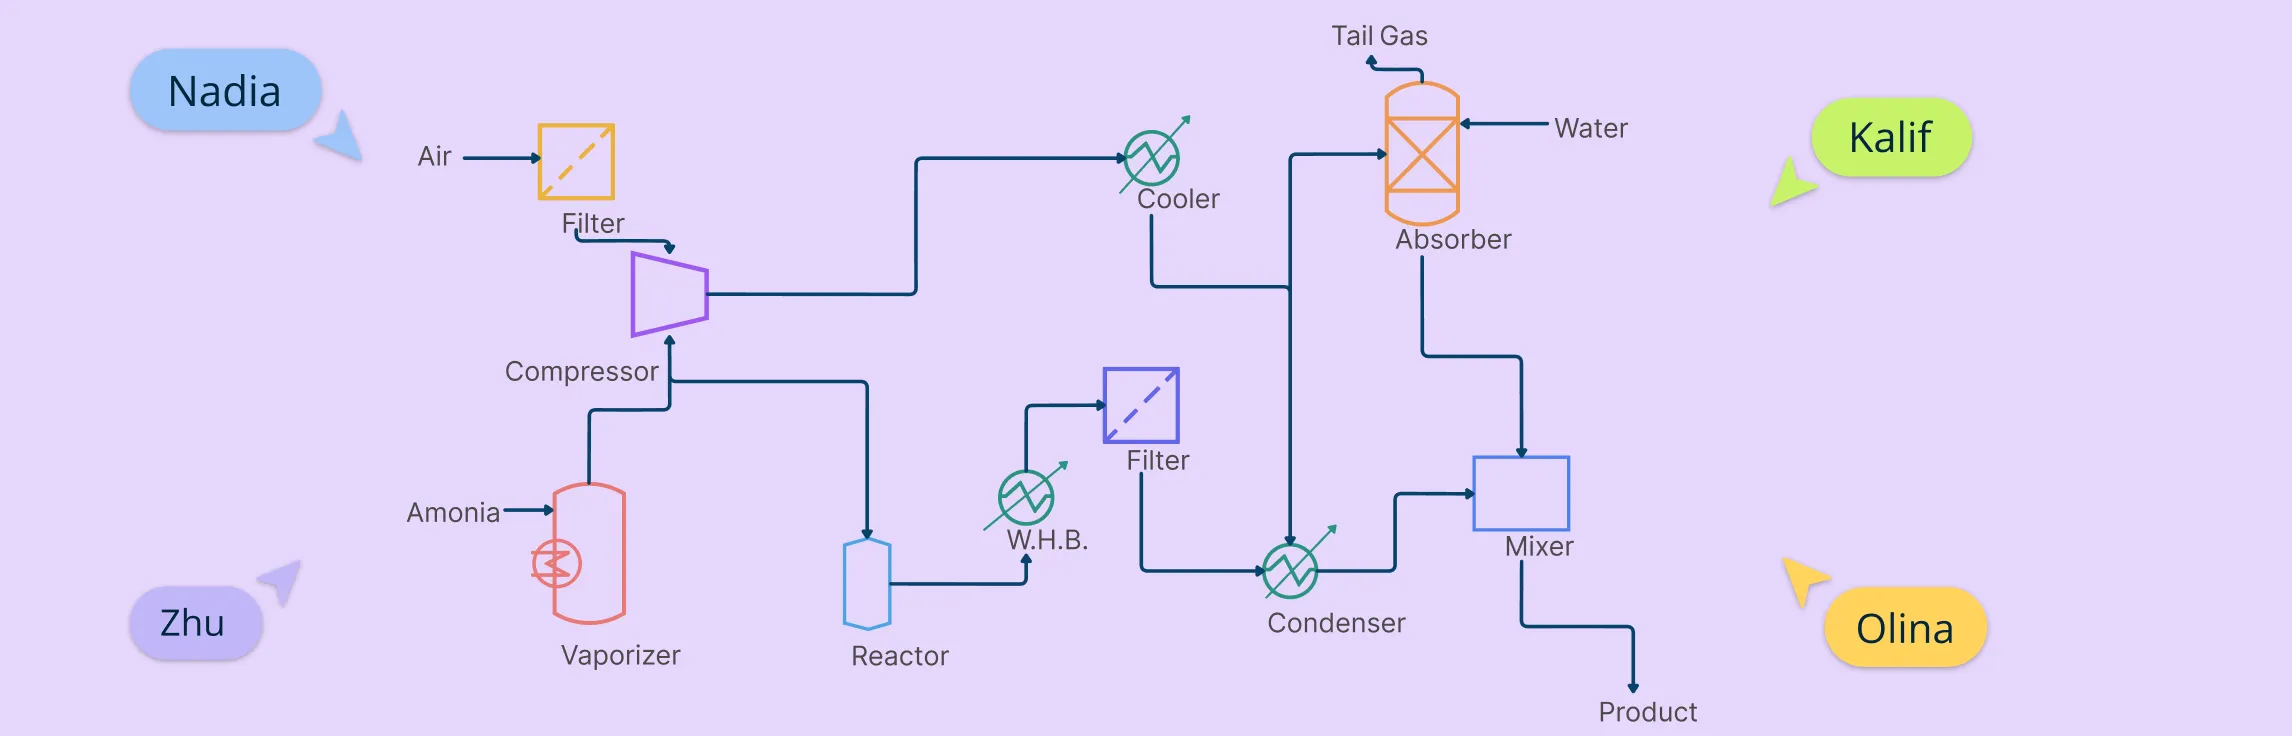
Process Flow Diagram Examples
Process flow diagram engineering


LNG process flow diagram

ETP process flow diagram

Process flow diagram of ethanol production

Cement production process flow diagram

Process flow diagram chemical engineering

When to Use a Process Flow Diagram
1. Documenting a process: A PFD makes it easy to capture and communicate how a process works. It’s useful for training, internal documentation, or compliance.
2. Improving efficiency and identifying bottlenecks: By mapping out each step, you can spot delays or unnecessary tasks and find opportunities to streamline operations.
3. Process optimization and standardization: A PFD helps you create consistent, repeatable workflows by showing the ideal flow for completing tasks.
4. Designing a new process: When planning something new, a PFD helps teams see how everything fits together before moving into execution.
5. Communicating across teams: Different teams can use a process diagram to understand the workflow without needing deep technical knowledge.
6. Compliance and safety planning: In regulated industries, PFDs are essential for meeting process documentation standards and ensuring safe operations.
7. Troubleshooting and maintenance: A clear diagram helps teams quickly find where problems occur and how to fix them with minimal downtime.
Who Can Use a Process Flow Diagram
Process flow diagrams are useful across many roles and industries:
1. Engineers and process designers: Used to design, improve, and troubleshoot technical or manufacturing workflows.
2. Business analysts and project managers: Help map out workflows, manage resources, and improve process efficiency.
3. Manufacturing and production teams: Ensure standardized procedures, consistent quality, and operational efficiency.
4. Compliance and safety officers: Used to meet safety standards and identify risks in regulated industries.
5. IT and software development teams: Visualize system workflows, data flows, and optimize development processes.
6. Educators and students: Help explain and understand complex processes in academic settings.
Benefits of Process Flow Diagrams
Process flow diagrams offer several advantages across industries:
1. Clear communication: They simplify complex workflows, making it easier for teams and stakeholders to understand and align.
2. Standardized processes: PFDs help create consistent, repeatable workflows that are easier to manage and improve.
3. Continuous improvement: They reveal inefficiencies and bottlenecks, helping teams optimize performance.
4. Better training and documentation: PFDs provide a visual reference that supports employee onboarding and process documentation.
5. Effective process design: They make it easier to build or revise processes by visualizing each step and its interactions.
References
www.sciencedirect.com. (n.d.). Process Flow Diagram - an overview | ScienceDirect Topics. [online] Available at: https://www.sciencedirect.com/topics/engineering/process-flow-diagram.
Kemper, B., de Mast, J. and Mandjes, M. (2009). Modeling process flow using diagrams. Quality and Reliability Engineering International, 26(4), pp.341–349. doi:https://doi.org/10.1002/qre.1061.
Nikos Filipu (2019). The Process Flow Diagram as an Aid in Academic Writing. International Conference celebrating the 65th birthday of Professor Todor Shopov entitled ‘The Pedagogy of Good Opportunities for Education for all’ held on 22 November 2017. [online] Available at: https://www.researchgate.net/publication/333339834.
FAQs About Process Flow Diagrams
What is the origin of the process flow diagram?
How to research and plan the process flow graphic?
What industries use process flow diagrams?
What is the difference between a process flow diagram and a flowchart?
Is a process flow diagram the same as a workflow diagram?