An Event-Driven Process Chain (EPC) diagram models the chronological and logical flow of a business process through events, functions, and AND, OR, or XOR connectors. It is especially useful when teams need to show what triggers an activity, what state results from it, and which role or system supports the work.
This guide explains EPC meaning, core and extended EPC symbols, modeling rules, creation steps, applications, benefits, history, and editable templates. It also compares EPC with BPMN and explains how to keep an EPC useful as current process documentation.
What Is an EPC Diagram
An Event-Driven Process Chain diagram, or EPC diagram, is a semi-formal business process modeling notation that represents the chronological and logical relationship between events and functions. Events describe conditions or states that trigger or result from work; functions represent the activities performed. Logical connectors define parallel or alternative paths, while extended EPC models can add organizational roles, information, documents, systems, and other supporting context.
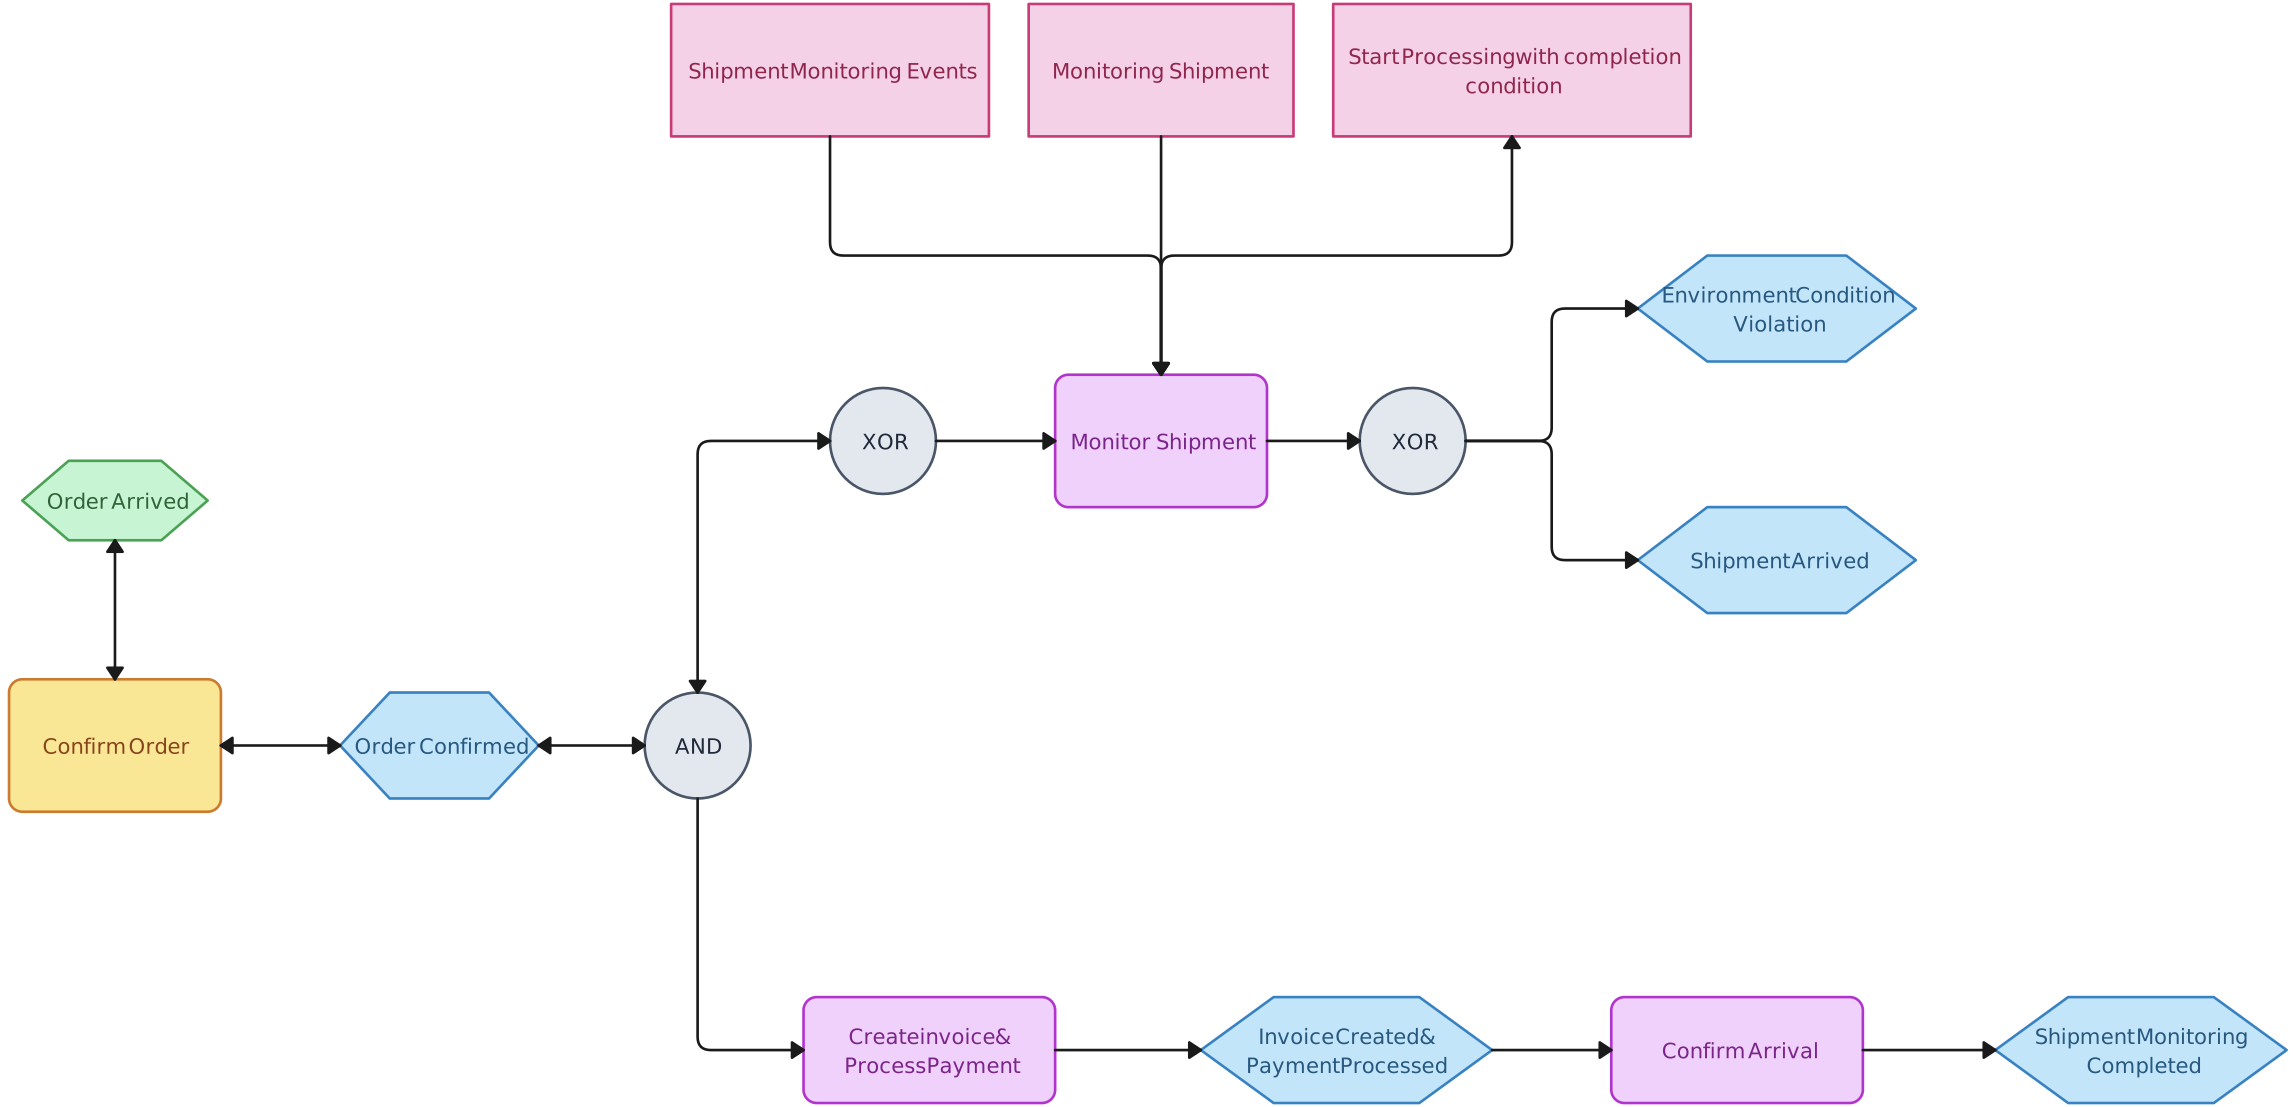

At its core, an EPC diagram consists of events (which describe the state of the process at a given point), functions (which represent activities or tasks that need to be performed), and logical connectors (such as AND, OR, and XOR, which define decision-making paths). These elements work together to provide a structured view of how a process flows from start to finish.
EPC diagrams are used in business process management (BPM), process analysis, and ERP-related process documentation. They can help teams examine dependencies, responsibilities, information needs, and handoffs, but the diagram does not automate or improve a process by itself. Whether documenting a current workflow or designing a future one, an EPC should be validated with process participants and maintained as the underlying work changes.
EPC Diagram Symbols
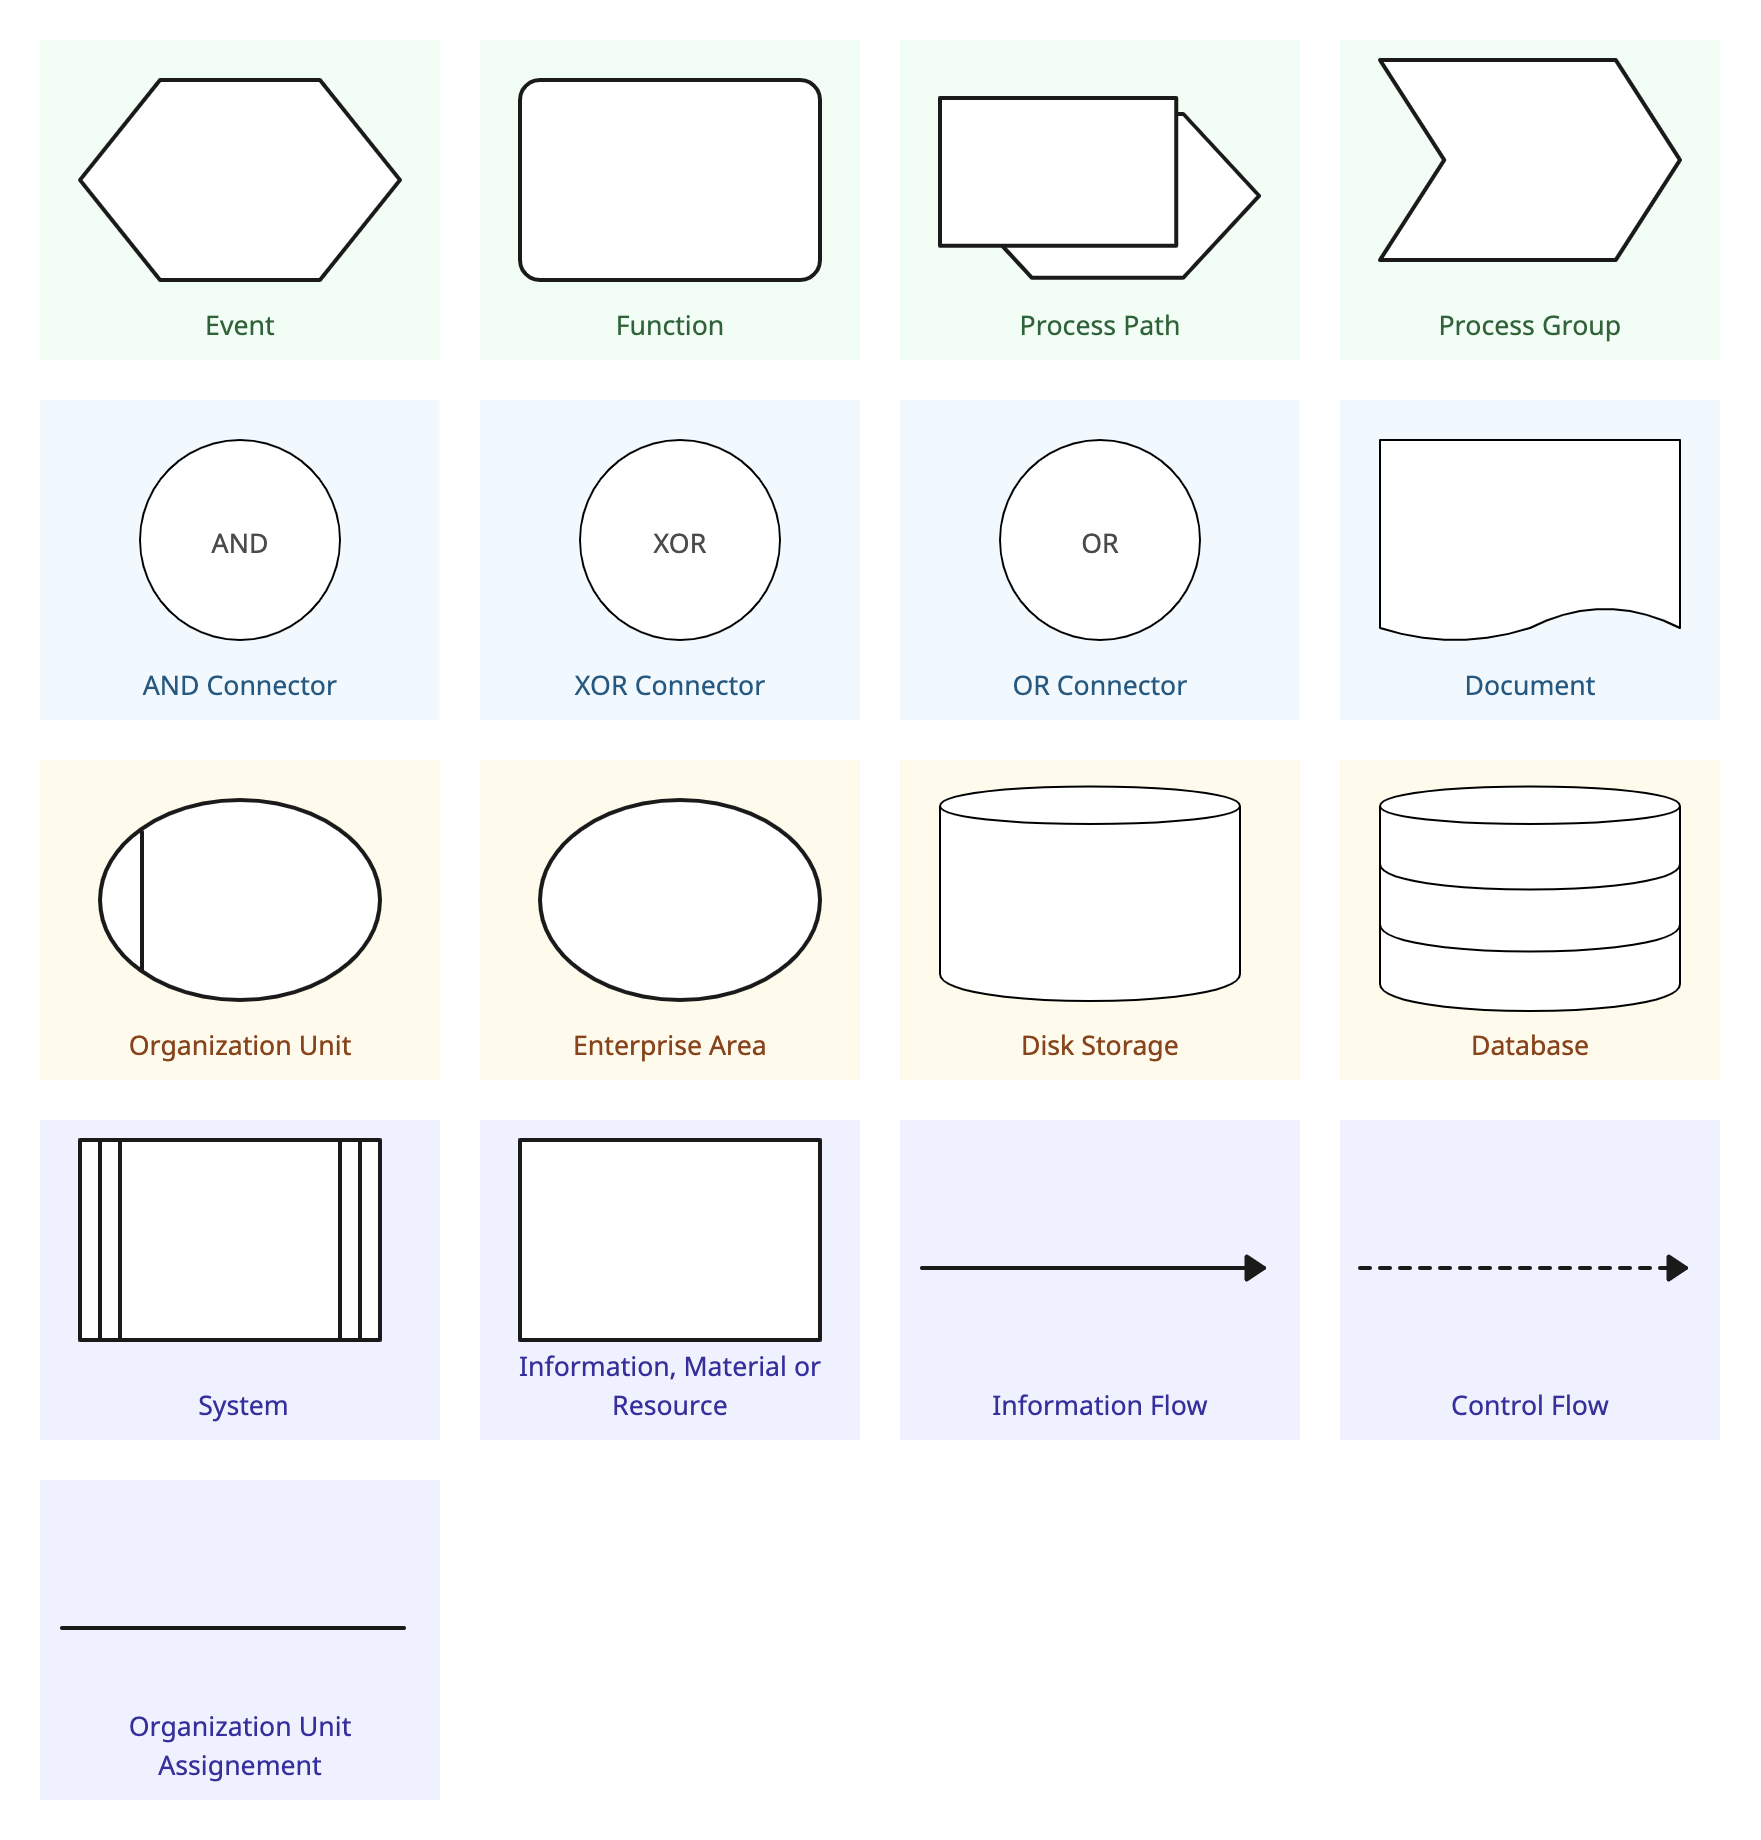
Event-driven process chain diagrams use events, functions, control-flow connections, and logical connectors as their core elements. Extended EPCs, often called eEPCs, add organizational units, documents, information objects, systems, resources, and related process references. Symbol availability can vary by modeling method and tool, so teams should agree on a notation convention before reviewing or sharing a model.
| Symbol | Definition |
| Event | Represents a specific state or condition that triggers or results from a function. Events define process starting points, intermediate states, or outcomes. |
| Function | Represents an activity, task, or operation performed within a process to transform inputs into outputs. |
| Process Path | Acts as a navigation link between different processes or subprocesses, helping to connect related workflows. |
| Process Group | Represents a collection of interrelated processes grouped for better organization and management. |
| Connectors |
|
| Document | Represents a physical or digital document used within the process, such as forms, reports, or contracts. |
| Organization Unit | Represents a specific department, role, or team responsible for performing a function. |
| Enterprise Area | Identifies a broader business unit, division, or area within an organization responsible for overseeing a process. |
| Disk Storage | Represents stored data on a disk, such as backups, logs, or records. |
| Database | Represents structured data storage in a database system, used for retrieving and managing information. |
| System | Represents an IT system or software application that supports or executes a function within the process. |
| Information/Material/Resources | Represents inputs such as data, physical materials, or resources used within a process. |
| Information Flow | Depicts the transfer of data, documents, or messages between functions, events, or organizational units. |
| Control Flow | Indicates the sequence and direction of process execution, guiding the transition between events, functions, and connectors. |
| Organization Unit Assignment | This links an organizational unit (e.g., department or role) to a specific function, showing which part of the organization is responsible for carrying out that function. |
How to Create an EPC Diagram
Follow these steps to create an EPC diagram that effectively models your business process, facilitating analysis, communication, and optimization.
Step 1. Define the scope and objectives
Begin by clearly identifying the specific business process you intend to model. Understanding the boundaries and purpose of this process is crucial. Determine the objectives behind creating the EPC diagram—whether it’s for process optimization, documentation, training, or identifying inefficiencies. This clarity will guide the level of detail and focus required in your diagram.
Step 2. Gather detailed information
Engage with stakeholders involved in the process to collect comprehensive information. Conduct interviews, workshops, or surveys to understand each step of the process. Additionally, review existing documentation, such as standard operating procedures, manuals, and reports, to ensure accuracy and completeness in your diagram.
Step 3. Choose the right diagramming tool
Select a diagramming tool that supports EPC modeling. Creately’s process mapping software provides editable EPC templates, diagramming shapes, attached connectors, and real-time collaboration. Choose a tool that supports the EPC elements your model requires and lets stakeholders review the diagram without separating feedback from the process context.
Step 4. Identify and define EPC elements
Break down the process into its fundamental components:
- Events: These are passive elements that describe the circumstances under which a function or a process works or the state resulting from a function or a process. For example, “requirement captured” or “material in stock.”
- Functions: Active elements representing tasks or activities performed within the process, such as “capture requirement” or “check material in stock.”
- Logical connectors: Symbols like AND, OR, and XOR that define the flow of control between events and functions, allowing for parallel or alternative execution paths.
- Organization units: Elements that determine which organization within the structure of an enterprise is responsible for a specific function, such as “sales department” or “procurement department.”
- Information objects: Representations of data or documents utilized or produced during the process, like “material” or “order.”
Step 5. Construct the EPC diagram
With all elements identified:
- Initiate with a triggering event: Place the initial event that starts the process at the top or beginning of your diagram.
- Sequence functions and events: Alternate between functions and events to depict the process flow accurately. Ensure that each function leads to an event and vice versa.
- Apply logical connectors appropriately: Use connectors to represent decision points, parallel processes, or converging paths. For example, an AND connector indicates parallel tasks, while an XOR represents exclusive choices.
- Assign organizational responsibilities: Link functions to their respective organizational units to clarify roles and responsibilities within the process.
- Attach relevant information objects: Connect data or documents to the functions where they are used or generated, providing a comprehensive view of information flow.
Step 6. Review, validate, and refine
After constructing the diagram:
Collaborate with stakeholders: Ask the people who perform, receive, or oversee the work to validate the events, functions, conditions, responsibilities, systems, and handoffs.
Record feedback in context: Use comments on the relevant part of the diagram so the accountable owner can resolve questions and incorporate agreed changes.
Refine the diagram: Correct missing or inaccurate paths, confirm connector logic, and make the model readable for its intended audience.
Step 7. Finalize and distribute
Once validated:
Ensure clarity and consistency: Double-check that all symbols are used consistently and that the diagram is free from ambiguities.
Share and maintain the diagram: Publish the validated EPC with its supporting documentation and identify who owns future updates. Review it whenever roles, systems, controls, or process steps change so it remains a living operational reference.
EPC Diagram Templates
Below, you’ll find ready-to-use EPC diagram templates that can be customized to fit your specific workflow needs.
Process Attributes EPC
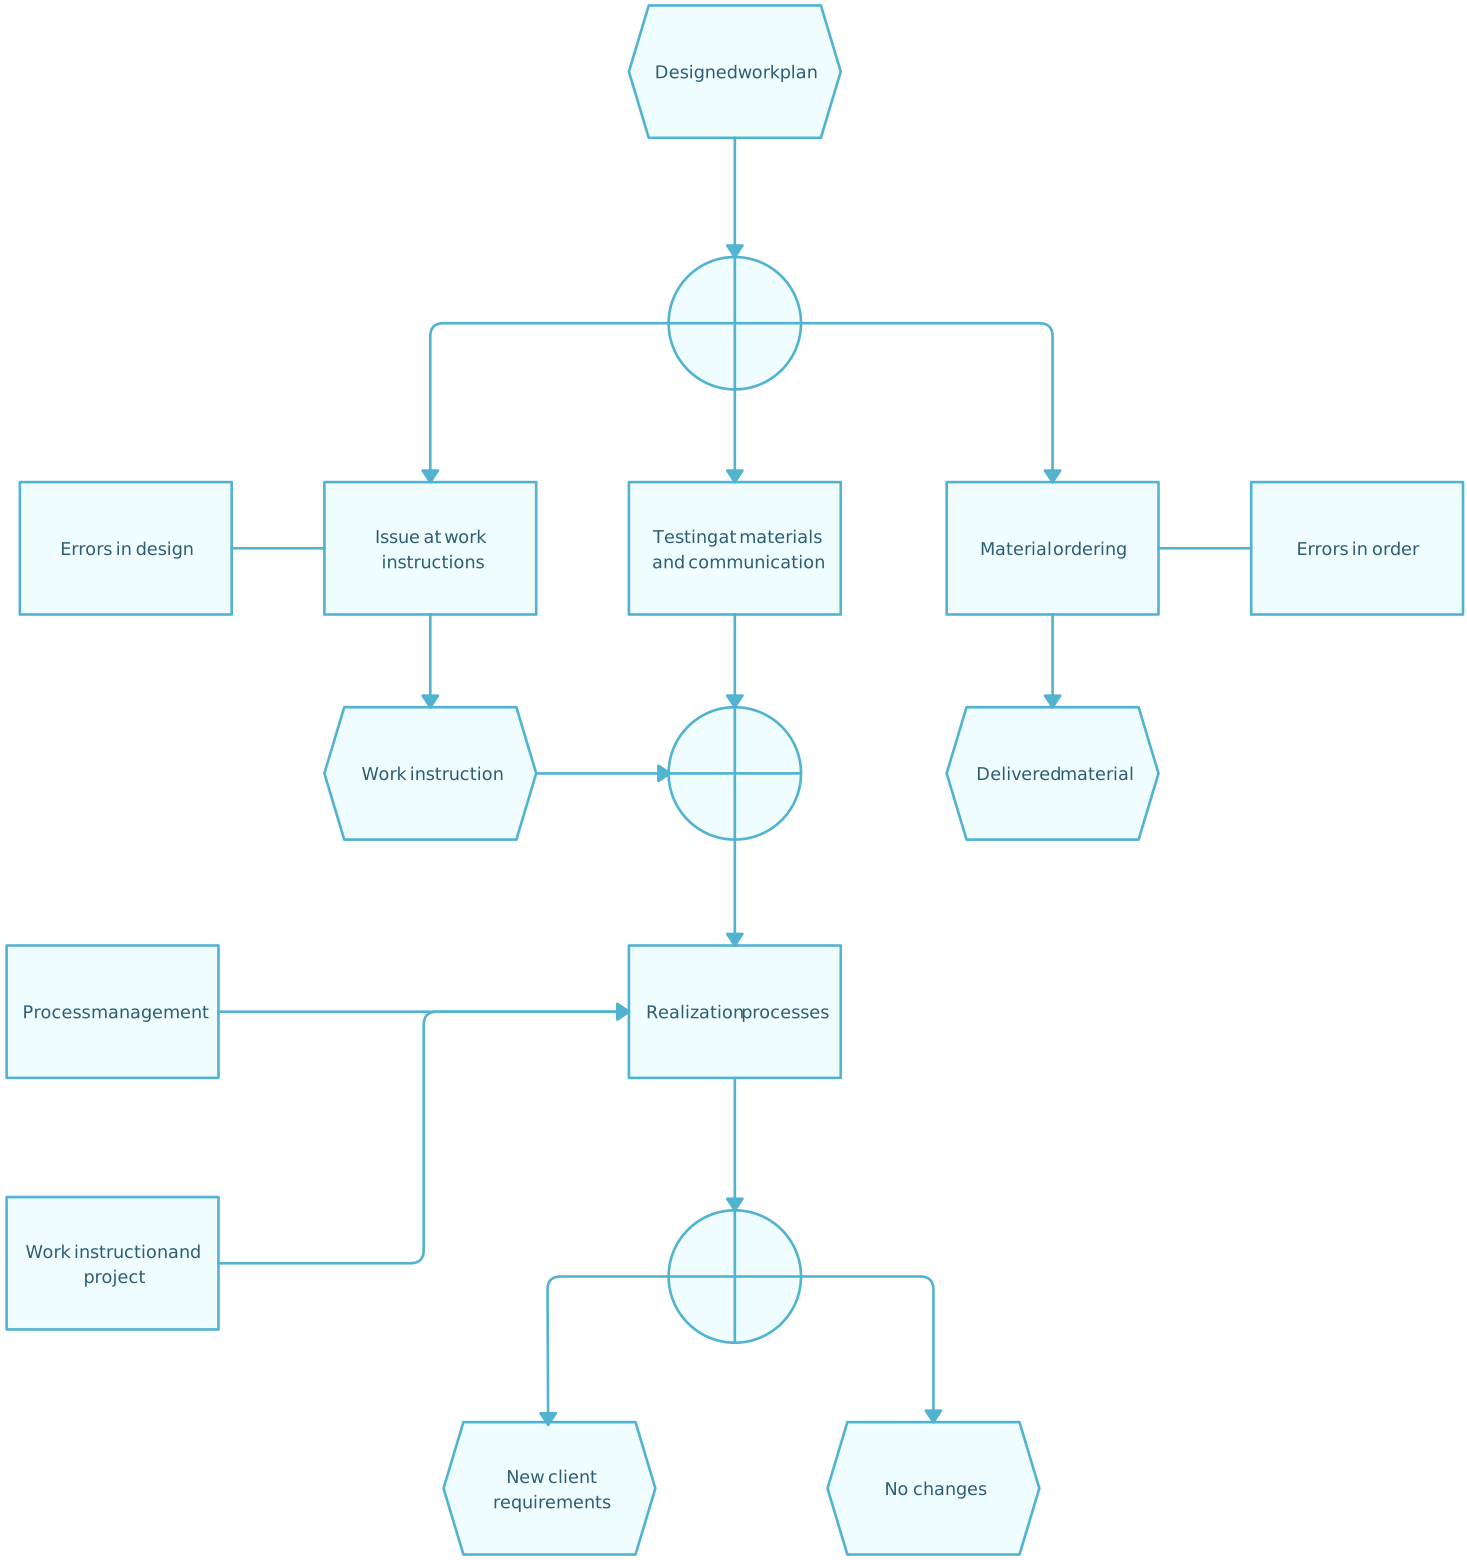
Simple Event Driven Process Chain (EPC)
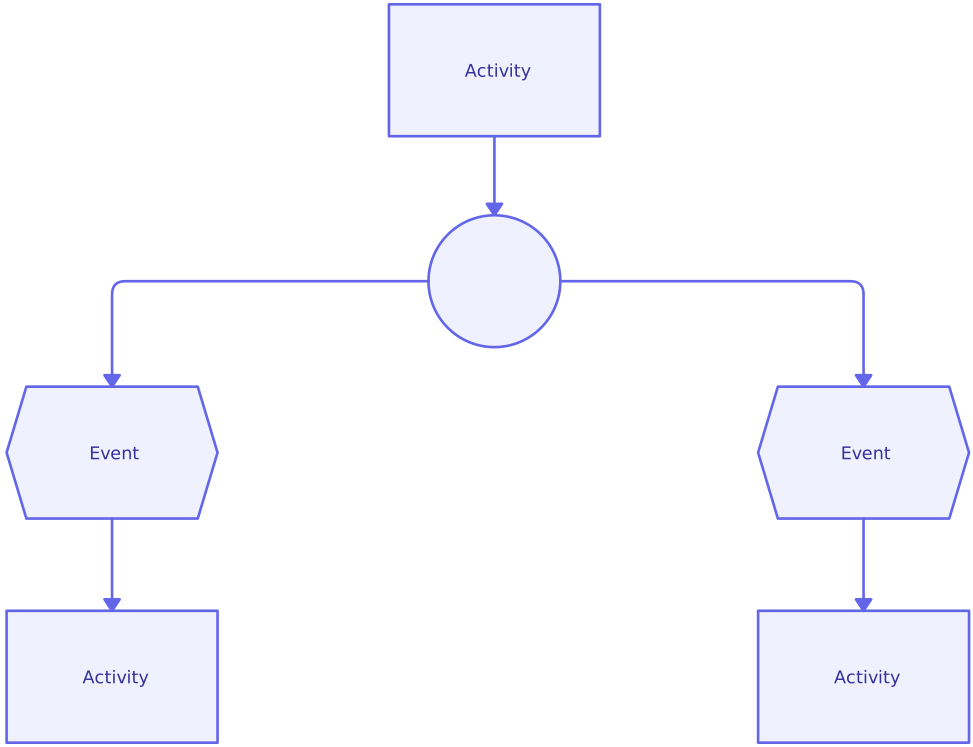
EPC Diagram Example
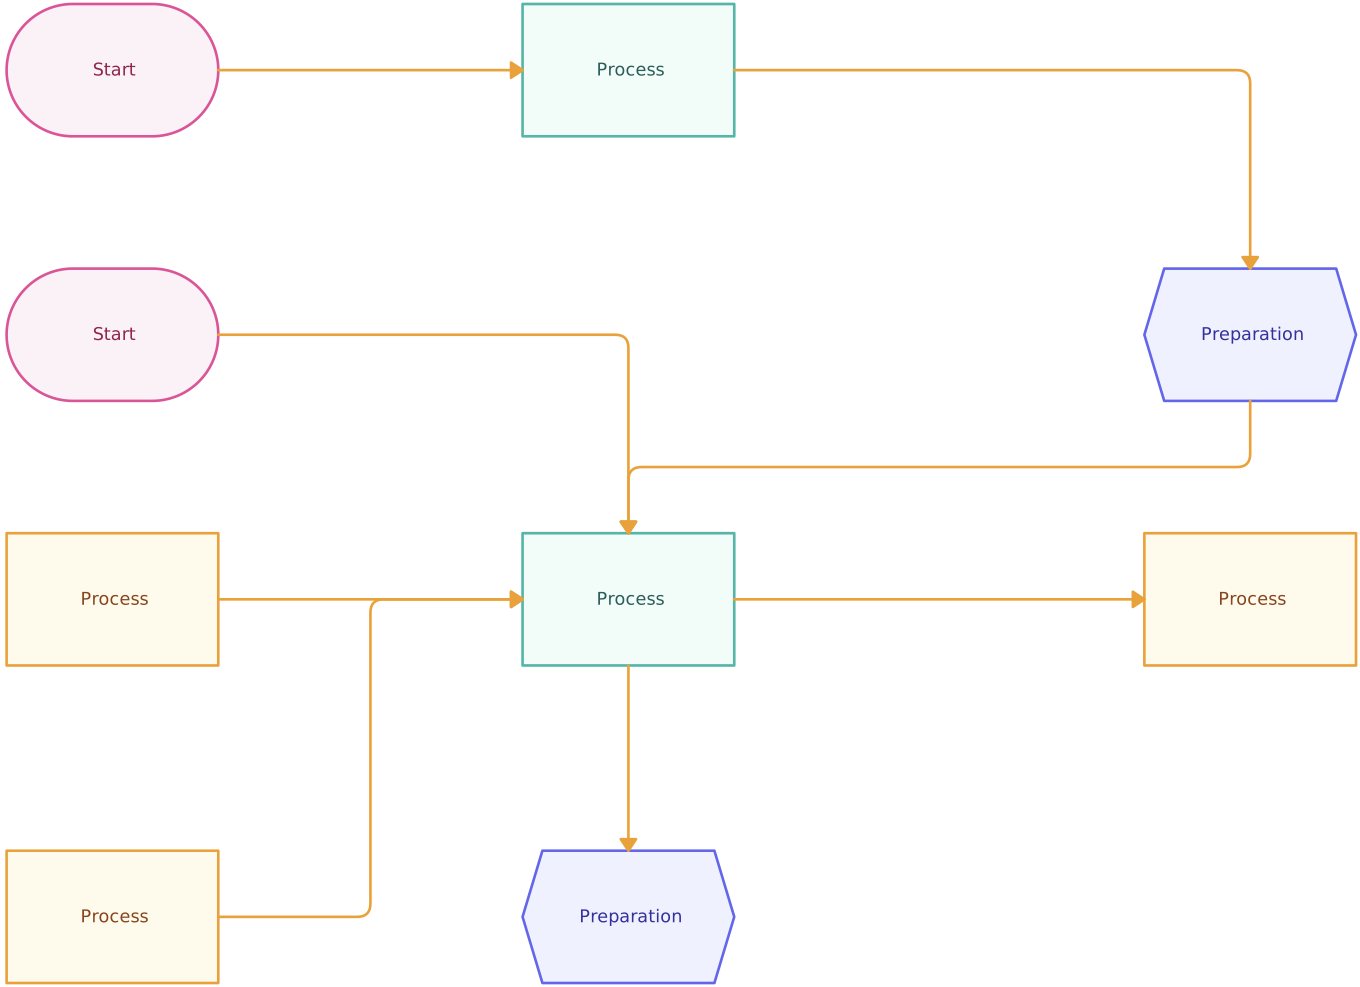
Event Driven Process Diagram
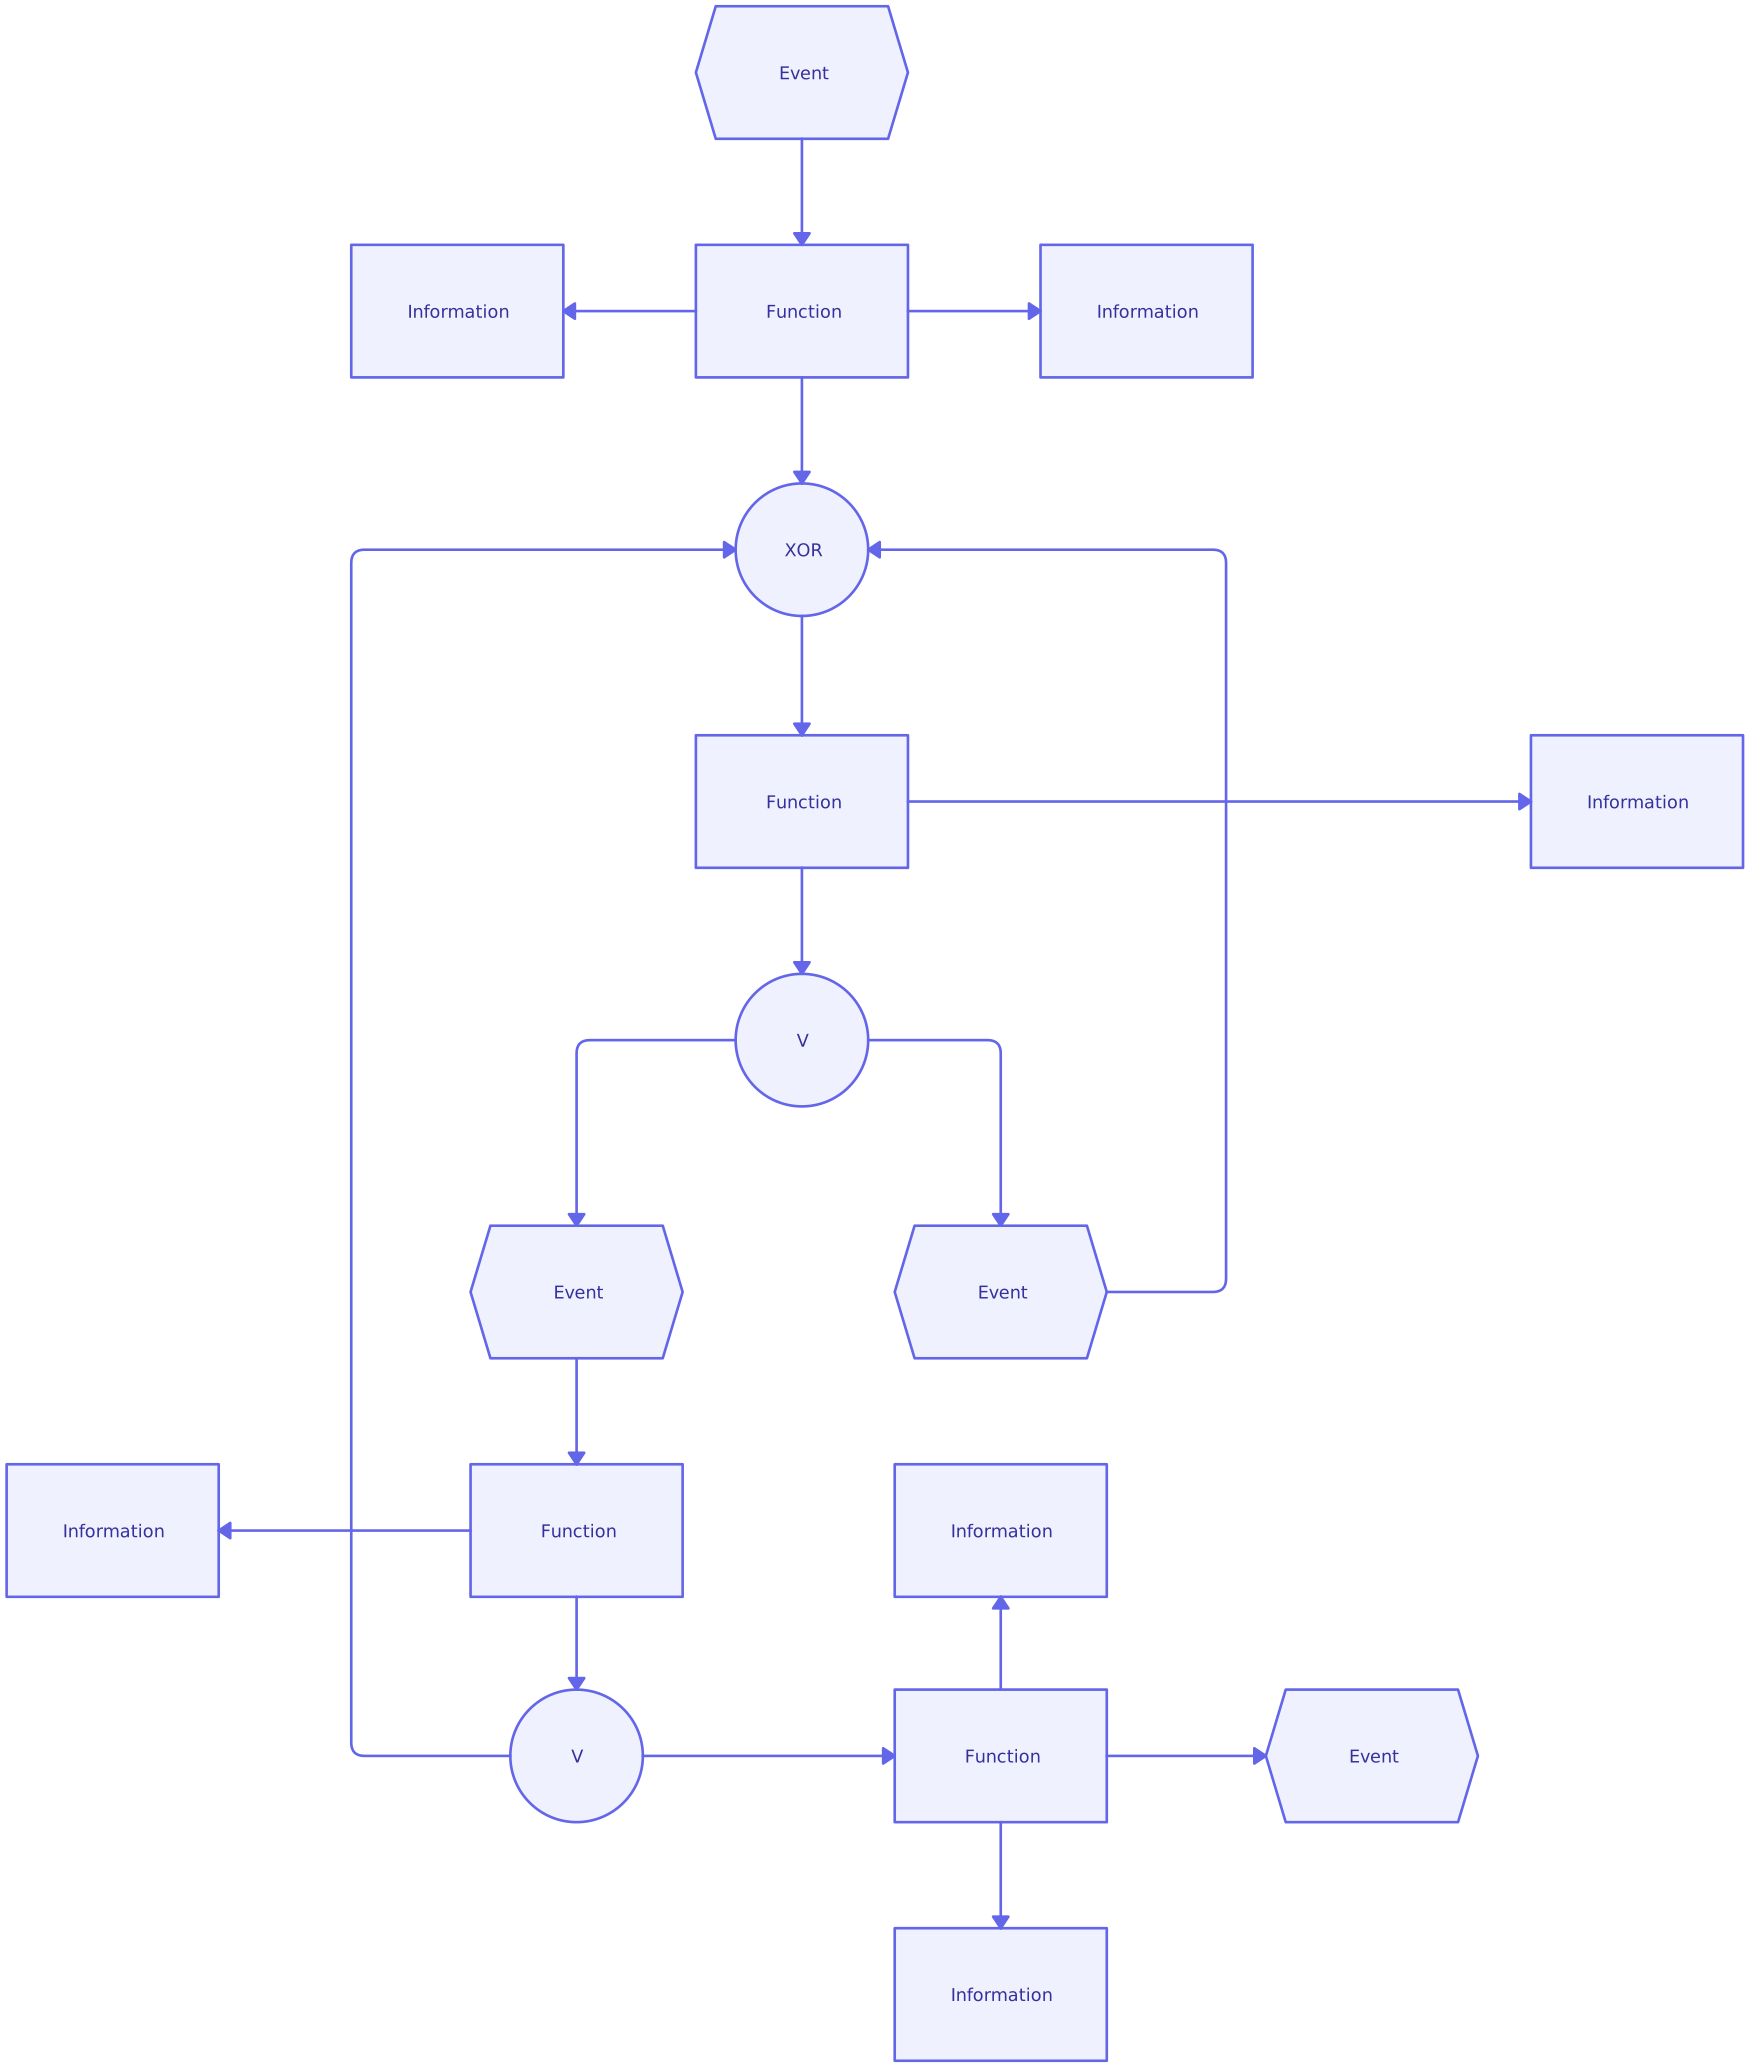
Event Driven Process Diagram
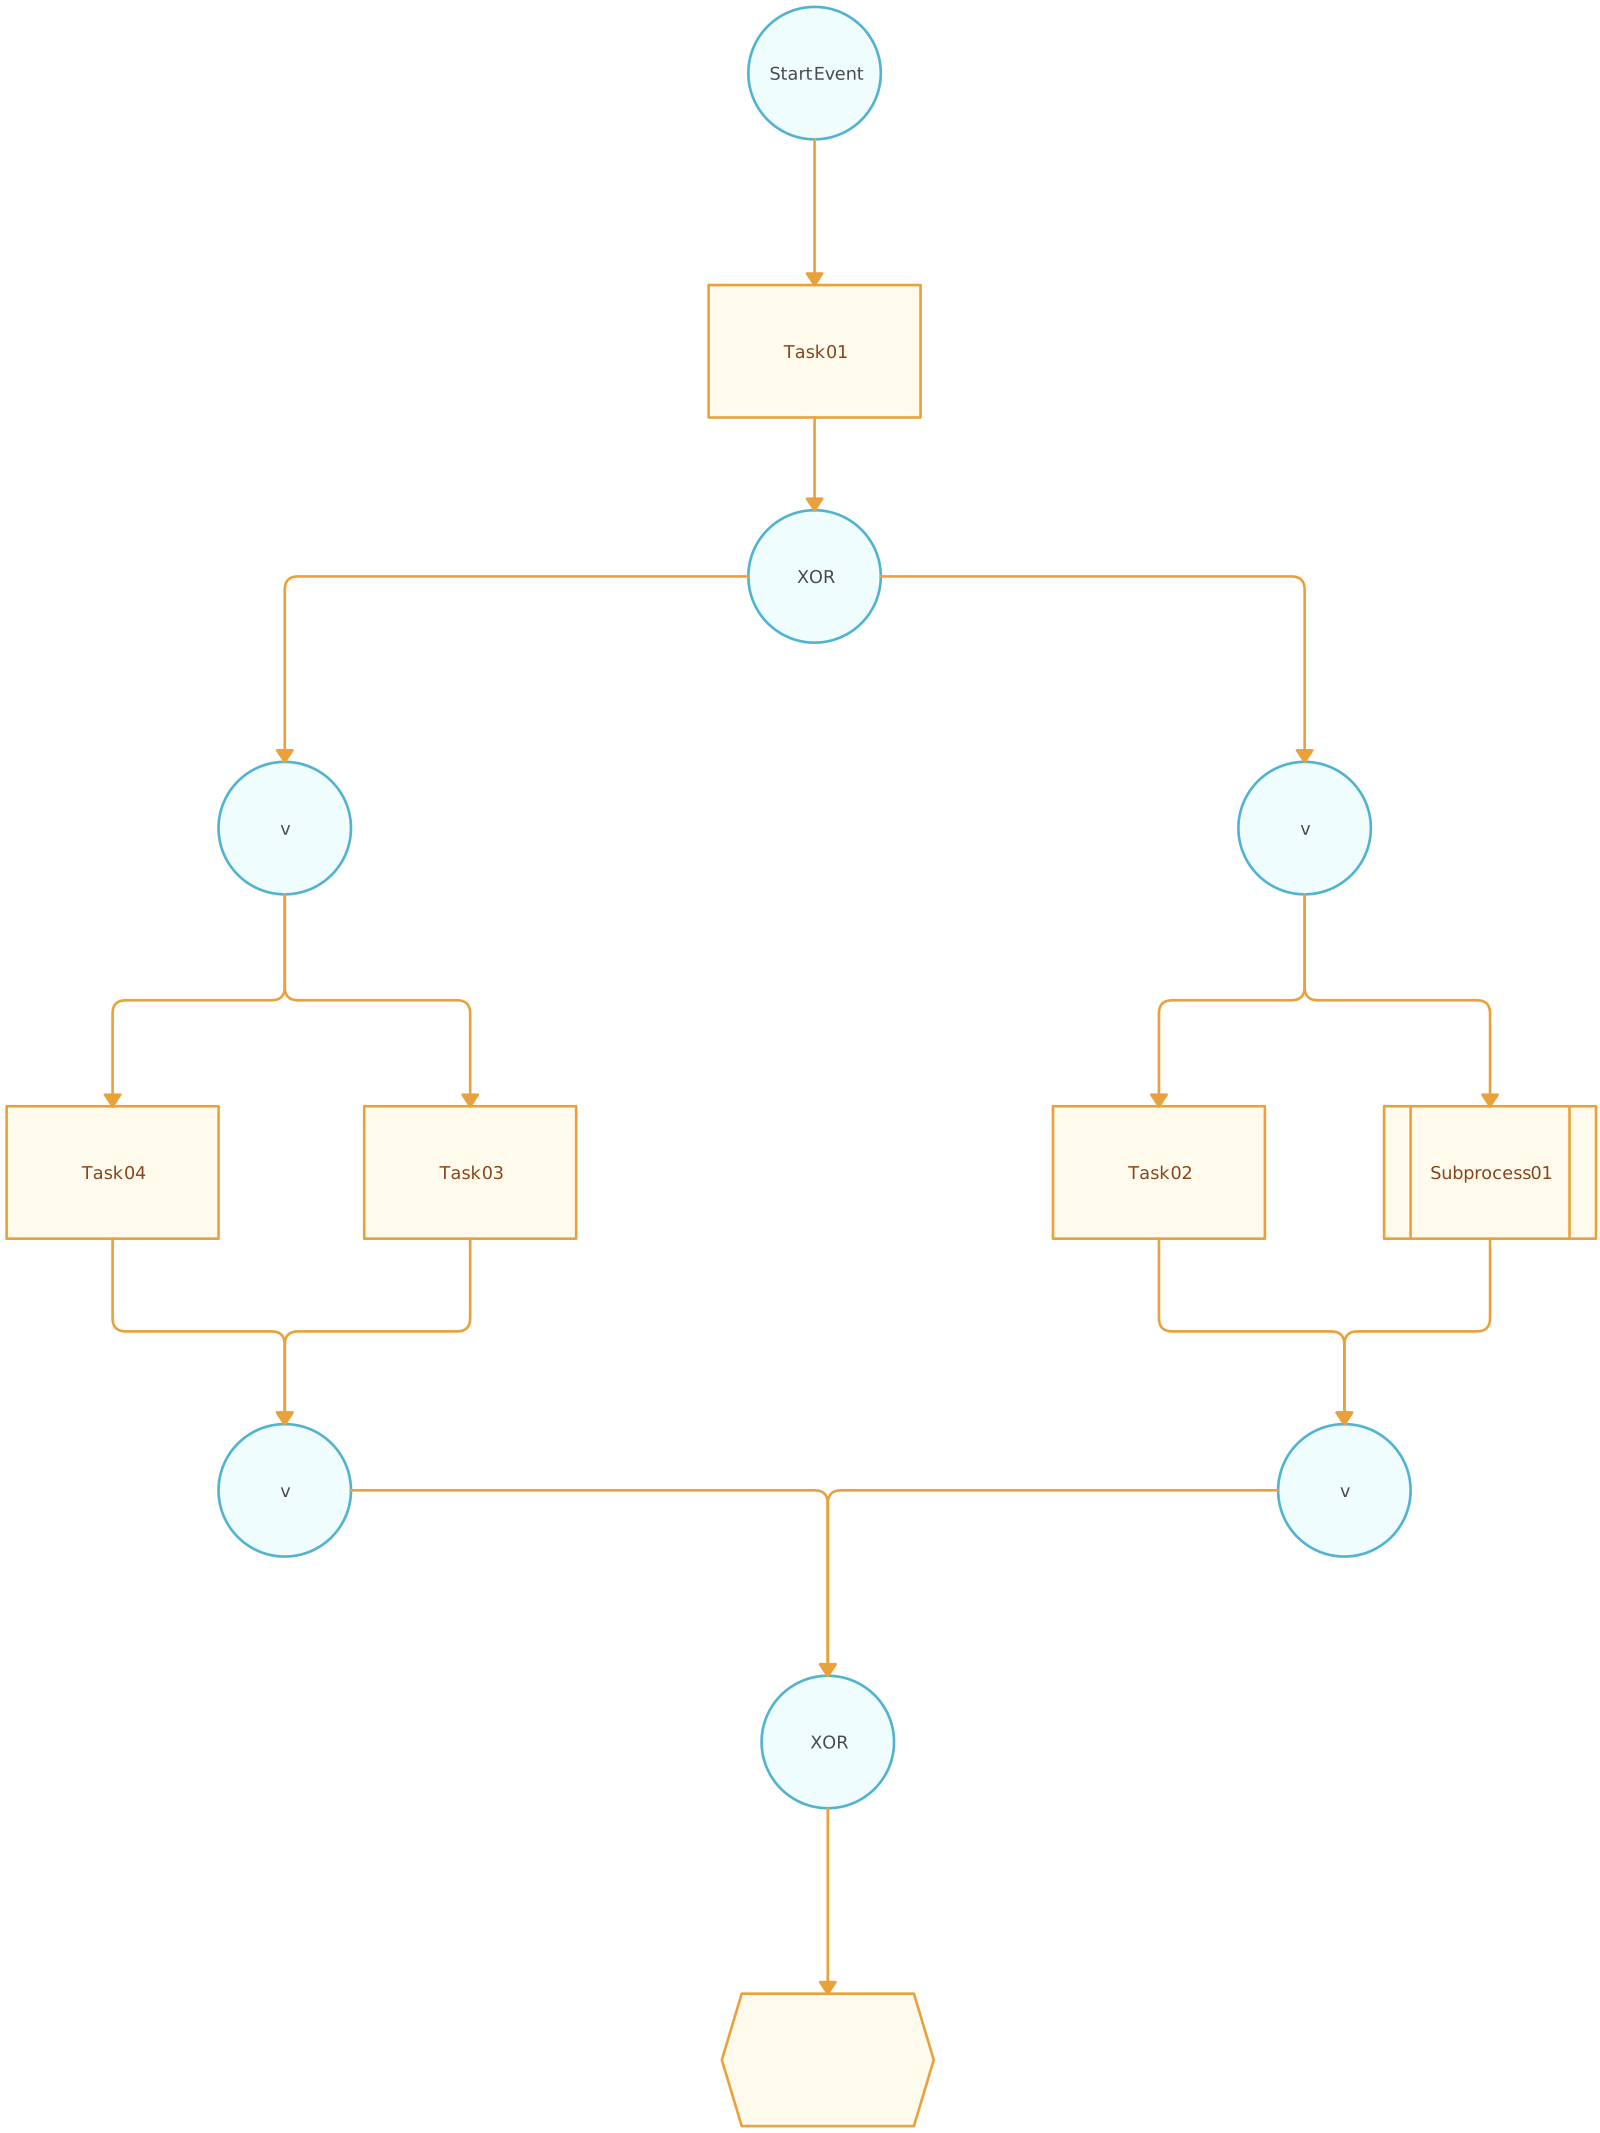
Importance of EPC Diagrams in Business Process Modeling
EPC diagrams play a vital role in business process modeling by providing a clear and structured way to visualize workflows. For businesses these diagrams are crucial for several reasons:
1. Clear understanding of processes
EPC diagrams offer a visual representation of how tasks, events, and decisions flow within a business process. By breaking down complex workflows into simple, easy-to-understand elements, businesses can better grasp how different steps interact. This clarity helps teams and stakeholders at all levels—whether in operations, management, or IT—understand the process more thoroughly, making it easier to spot inefficiencies or bottlenecks.
2. Identifying areas for improvement
One of the key benefits of EPC diagrams is their ability to highlight process inefficiencies. By mapping out a process step-by-step, organizations can pinpoint where delays, redundancies, or errors occur. This provides an opportunity for process optimization, helping businesses increase efficiency, reduce costs, and improve overall productivity.
3. Better communication across teams
EPC diagrams foster better communication and collaboration across departments. With a clear visual map of how a process works, teams in different areas—such as sales, finance, or customer service—can align their efforts and work together more effectively. This is especially important in large organizations where multiple teams are involved in complex workflows.
4. Streamlining compliance and documentation
For regulated work, an EPC can document activities, responsibilities, systems, information, and control points in one visual model. This can support reviews and audit preparation, but it does not demonstrate that the process is compliant or consistently followed without supporting evidence and appropriate validation.
5. Improving decision-making
By illustrating the various paths and decision points in a process, EPC diagrams provide valuable insights that support better decision-making. Managers can use these diagrams to evaluate different scenarios, assess risks, and make informed choices about process adjustments or improvements.
When to Use EPC Diagrams
The application of EPC diagrams in business helps organizations document, analyze, and improve processes. Here are key scenarios where EPC diagrams can improve business performance.
1. Process mapping and documentation
Whenever a company wants to clearly document how a specific process works, an EPC diagram is a great tool. It helps break down complex workflows into easy-to-understand visual steps. This is useful for businesses that need to formalize their operations, especially when they want to standardize procedures or onboard new employees. By mapping out processes, businesses can ensure consistency and clarity across teams.
2. Identifying and resolving process bottlenecks
When a business notices inefficiencies or delays in its operations, EPC diagrams can be used to analyze the workflow and identify bottlenecks. For example, if there’s a delay in processing customer orders, an EPC diagram can help pinpoint exactly where the holdup occurs. By visualizing the process in detail, companies can make data-driven decisions to improve workflow efficiency.
3. Improving compliance and meeting regulations
In industries such as healthcare, finance, and manufacturing, EPC diagrams can document where regulatory or internal requirements affect a process. For example, a healthcare EPC could show patient-intake activities, responsible roles, information exchanges, and relevant control points. The model can support an audit trail when it is connected to current procedures and evidence, but the diagram alone does not prove compliance.
4. Process optimization and continuous improvement
EPC diagrams are perfect for companies aiming to optimize their processes over time. Once a process is mapped out, businesses can analyze it to find opportunities for improvement. Whether it’s reducing unnecessary steps, automating certain tasks, or reallocating resources, EPC diagrams provide a clear overview that helps businesses make changes for continuous improvement. This is particularly useful for organizations adopting lean management or Six Sigma methodologies.
5. Training and onboarding
When training new employees, especially in large organizations, it can be difficult to explain complex processes through written instructions alone. EPC diagrams simplify this by providing a visual tool that helps new hires quickly understand the steps they need to follow. For example, a customer service department can use an EPC diagram to show how to handle a customer complaint from start to finish, making it easier for new team members to grasp the workflow.
6. Cross-departmental collaboration
EPC diagrams are especially helpful in businesses where multiple departments are involved in a single process. For example, in a manufacturing company, the production, quality control, and logistics teams might each be responsible for different steps in the process. An EPC diagram helps visualize how these teams interact and how their tasks depend on one another, fostering better collaboration and coordination.
7. Software and system design
In industries that rely on complex software or systems, EPC diagrams are used to map out processes for system design and optimization. This is particularly useful for IT teams who need to understand how software modules interact within a larger business process. EPC diagrams help identify system requirements and ensure that the software supports business operations efficiently.
Benefits of Event-Driven Process Chain Diagrams
EPC diagrams offer several benefits that can greatly improve business processes. Here are some key advantages:
1. Clear visualization of workflows
EPC diagrams make complex processes easier to understand by providing a visual map of each step, ensuring everyone in the organization is on the same page.
2. Improved decision-making
By providing insights into process flows, EPC diagrams help businesses make smarter, more informed decisions, such as identifying bottlenecks and evaluating alternatives.
3. Process optimization and efficiency
EPC diagrams highlight inefficiencies, allowing businesses to streamline processes, reduce waste, and improve overall efficiency.
4. Enhanced collaboration and communication
With a common visual language, EPC diagrams improve cross-functional communication, ensuring smoother workflows and better teamwork.
5. Better documentation and compliance
For regulated work, EPC diagrams can make responsibilities and control points easier to review when they are supported by current procedures, records, and evidence.
6. Streamlined training and onboarding
EPC diagrams help new employees understand processes quickly, reducing training time and improving onboarding efficiency.
7. Continuous improvement
By regularly reviewing EPC diagrams, businesses can identify areas for improvement and stay competitive by optimizing operations over time.
History of Event-Driven Process Chains
Event-driven Process Chains are a business process modeling notation rather than simply a type of flowchart. EPC was developed in the early 1990s by Gerhard Keller, Markus Nüttgens, and August-Wilhelm Scheer in the context of ARIS and the documentation of SAP R/3 business processes.
The development of EPC was part of the broader Architecture of Integrated Information Systems (ARIS) approach, which connects process modeling with organizational, data, function, and system perspectives. Its close association with ARIS and SAP process documentation contributed to its adoption in enterprise process-modeling projects.
Over time, the original notation was extended into eEPC to connect the control flow with organizational units, information objects, documents, systems, risks, and other business context. Implementations and modeling conventions can differ, so modelers should document the notation rules used in a particular organization.
EPC remains useful for teams that need an event-and-function view of business processes, particularly when process analysis is connected to ERP or broader enterprise-modeling work.
How to Use Creately to Create EPC Diagrams
Creately’s process mapping software helps teams create EPC diagrams and maintain the operational context around them. Use the EPC notation for event-and-function modeling, while applying the broader Process capabilities only where they fit the workflow.
1. Start with a template or a blank canvas
Open an editable EPC template to study a completed structure, or begin with a blank canvas when the process requires a custom model. Define the scope, audience, start events, and intended level of detail before adding elements.
2. Use the built-in EPC symbols
Add events, functions, logical connectors, organizational units, documents, systems, and other relevant EPC elements. Alternate events and functions in the control flow, use AND, OR, and XOR connectors carefully, and attach organizational or information context to the functions it supports.
3. Customize and style your diagram
Use consistent colors, labels, connector directions, and spacing to distinguish control flow from supporting relationships. Styling should improve readability without replacing the meaning carried by EPC symbols.
4. Collaborate in real time
Process participants can edit together, see collaborators on the canvas, and use contextual comments to discuss specific functions, events, or handoffs. Accountable owners can incorporate agreed feedback and keep the EPC current as the underlying process changes.
5. Access anywhere, anytime
Use the shared cloud workspace to open and review the source EPC from supported browsers, whether participants are working together or asynchronously. Keep notes, links, and file attachments connected to relevant shapes. Where applicable, supported structured properties such as owner, status, duration, systems, tags, triggers, and SLAs can add operational detail alongside the EPC notation. Link overview diagrams to detailed subprocess maps when readers need more context.
6. Export and share with ease
Share the diagram with stakeholders or export it as PNG, PDF, or SVG, depending on the plan. Treat exported files as snapshots; maintain the shared source diagram as living process documentation and identify who is responsible for future updates.
Conclusion: What Is an EPC Diagram
EPC diagrams provide a structured way to show how events trigger functions and how functions produce new process states. They are particularly useful for event-and-function analysis, ERP-related process documentation, and workflows that benefit from extended organizational and information context. The value comes from validating the model with participants, assigning accountable ownership, and maintaining the diagram as the process changes—not from the diagram alone.
References
M. Nüttgens, Feld, T. and Zimmermann, V. (1998). Business Process Modeling with EPC and UML: Transformation or Integration? pp.250–261. doi:https://doi.org/10.1007/978-3-642-48673-9_17.
Loos, P. and Allweyer, T. (1998). Object-orientation in business process modeling through applying event driven process chains (EPC) in UML. [online] IEEE Xplore. doi:https://doi.org/10.1109/EDOC.1998.723246.
FAQs About EPC Diagrams
What is an EPC diagram used for?
What are the main components of an EPC diagram?
How do EPC diagrams help in business process improvement?
What is the difference between EPC and BPMN diagrams?