Fishbone Diagram Maker
Visualize Root Causes with Cause and Effect Diagrams
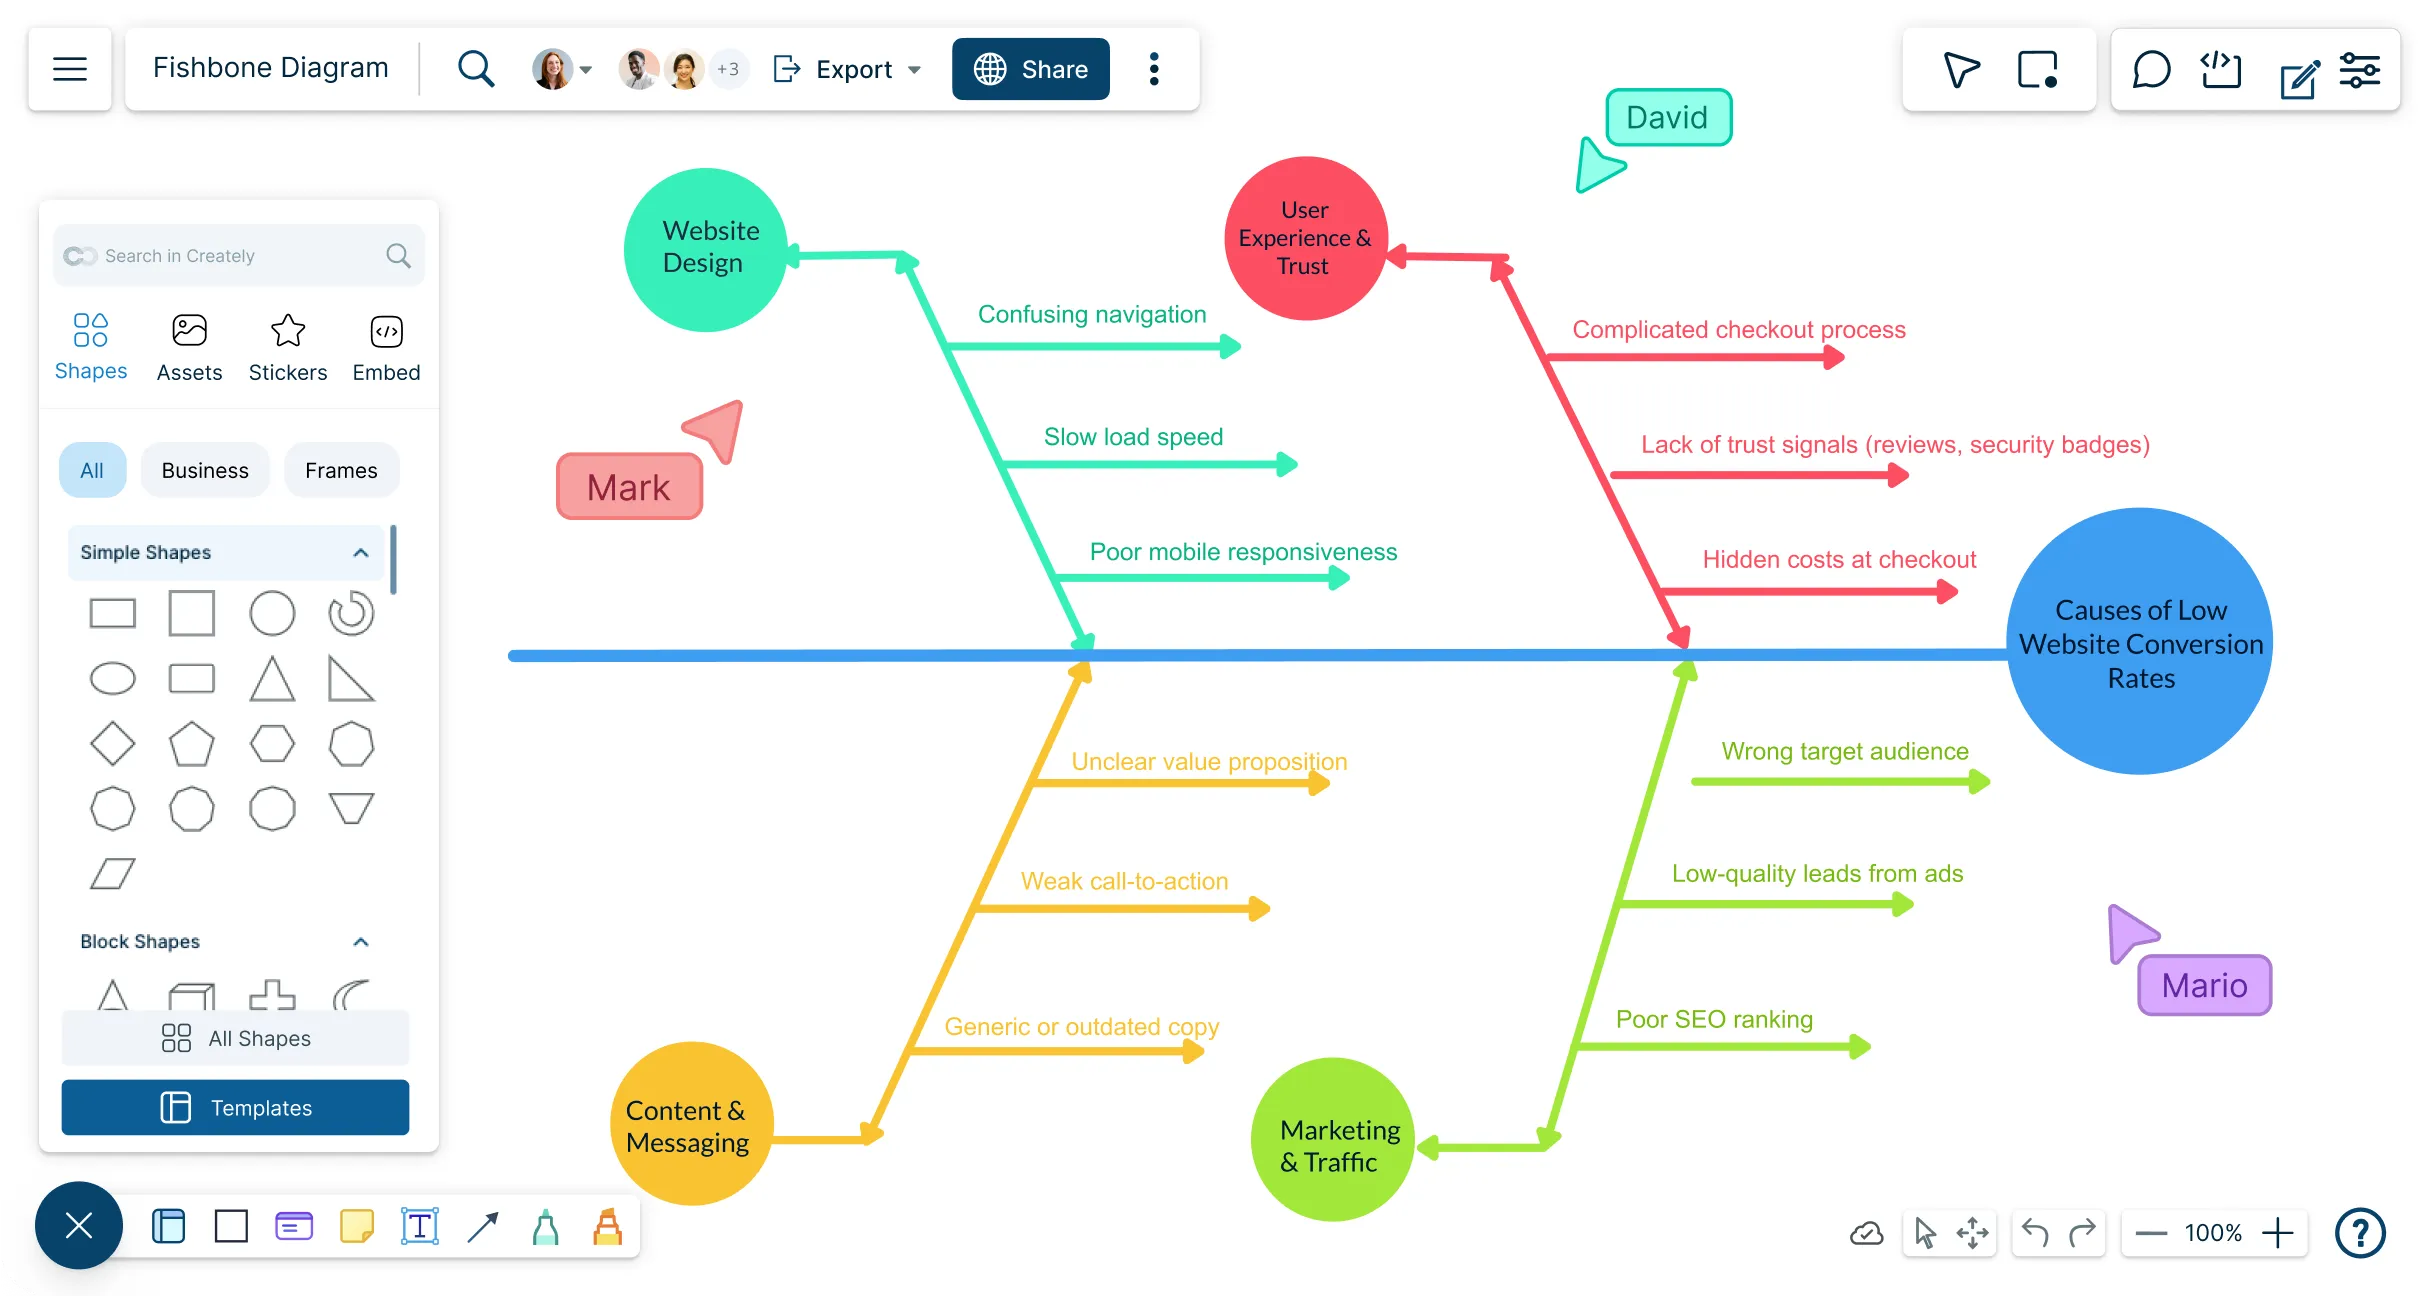
Turn scattered ideas, evidence, and team input into a structured fishbone diagram in minutes. Organize possible causes, spot what may be missing, and focus your investigation on the factors most likely to be driving the problem.
Start with an editable template built for your problem or industry
Add and organize possible causes without manually formatting the diagram
Collaborate with your team, prioritize findings, and plan what to investigate next



 Diagramming Visual Collaboration Org Chart


How to Create a Fishbone Diagram in Creately?
Define the Problem
Write a specific problem statement at the head of the diagram so everyone understands what is being investigated.
Choose the Cause Categories
Add categories that reflect the problem, such as people, processes, equipment, materials, environment, policies, or management.
Capture Possible Causes
Brainstorm with the people closest to the issue and add possible causes and sub-causes under the relevant branches.
Compare and Investigate
Review the diagram for repeated themes, missing information, unsupported assumptions, and causes that require more evidence.
Agree on the Next Steps
Prioritize the most likely causes, assign further investigation or corrective action, and share the completed analysis with stakeholders.
Watch the quick Creately walkthrough to see how to create a fishbone diagram, organize possible causes, and investigate a problem with your team.
Create a Fishbone DiagramBreak Down Complex Problems Faster
When possible causes are coming from different people, reports, and discussions, it can be difficult to see how they fit together. Bring them into one structured view so your team can explore every angle without losing track of the problem.
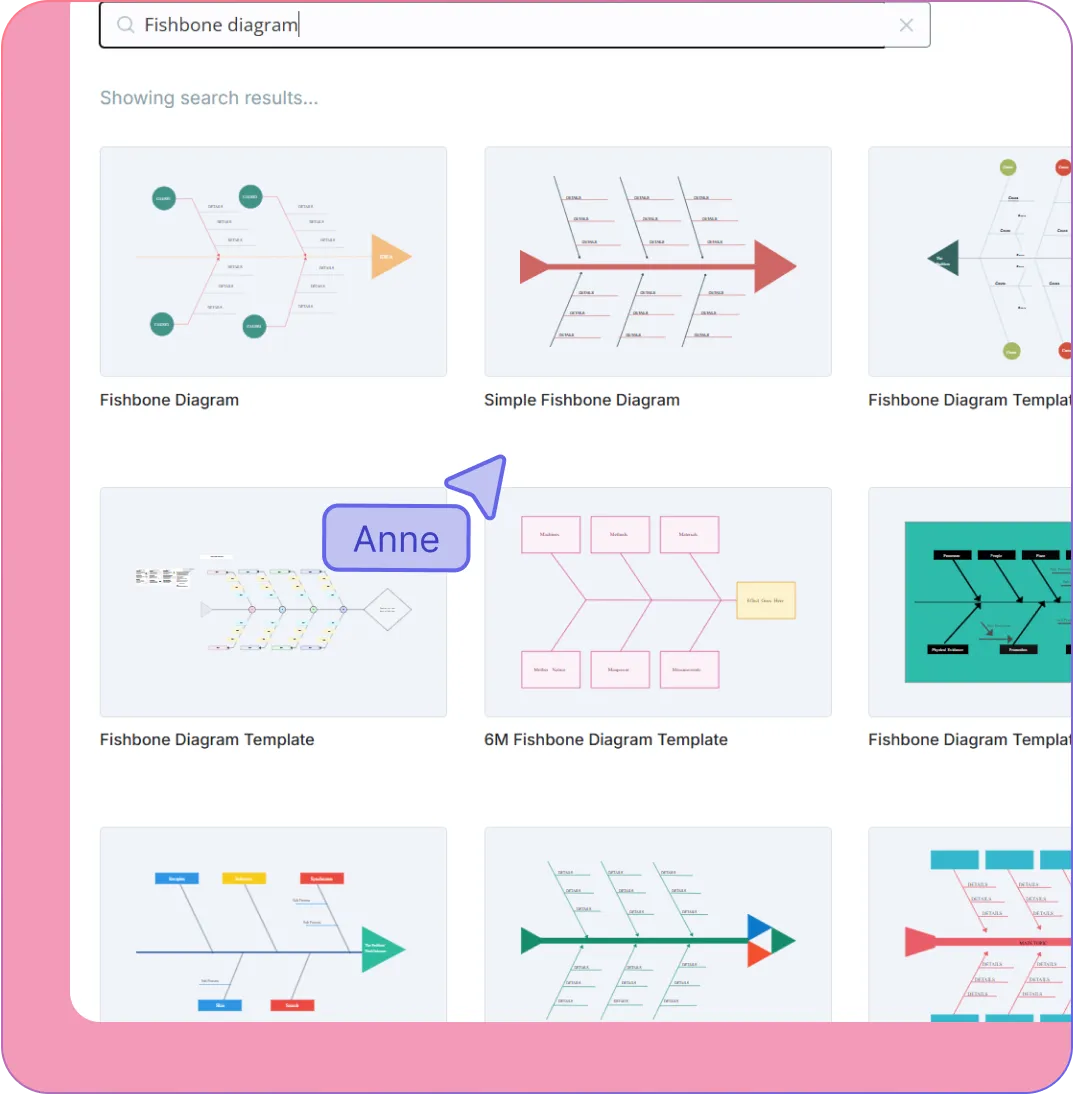
Start quickly with editable fishbone templates for quality, manufacturing, healthcare, service, project, and business problems.
Organize causes using the 6Ms, 4Ps, 4Ss, or categories tailored to your own process.
Add, move, and expand causes and sub-causes without manually rebuilding the diagram.
Capture early ideas with sticky notes, then organize them under the relevant branches.
Use colors, labels, notes, and visual markers to distinguish evidence, assumptions, themes, and priorities.
Build the Analysis With the People Who Know the Problem
The strongest insights often come from the people working closest to the issue. Bring teams, specialists, and stakeholders into one shared workspace so the analysis reflects what is really happening, not just what is assumed.
Brainstorm and add possible causes together in real time, wherever participants are working.
Discuss specific causes directly on the diagram with comments, replies, and @mentions.
Use reactions or voting to surface the causes the team believes need closer investigation.
Give each participant view, comment, or edit access based on how they need to contribute.
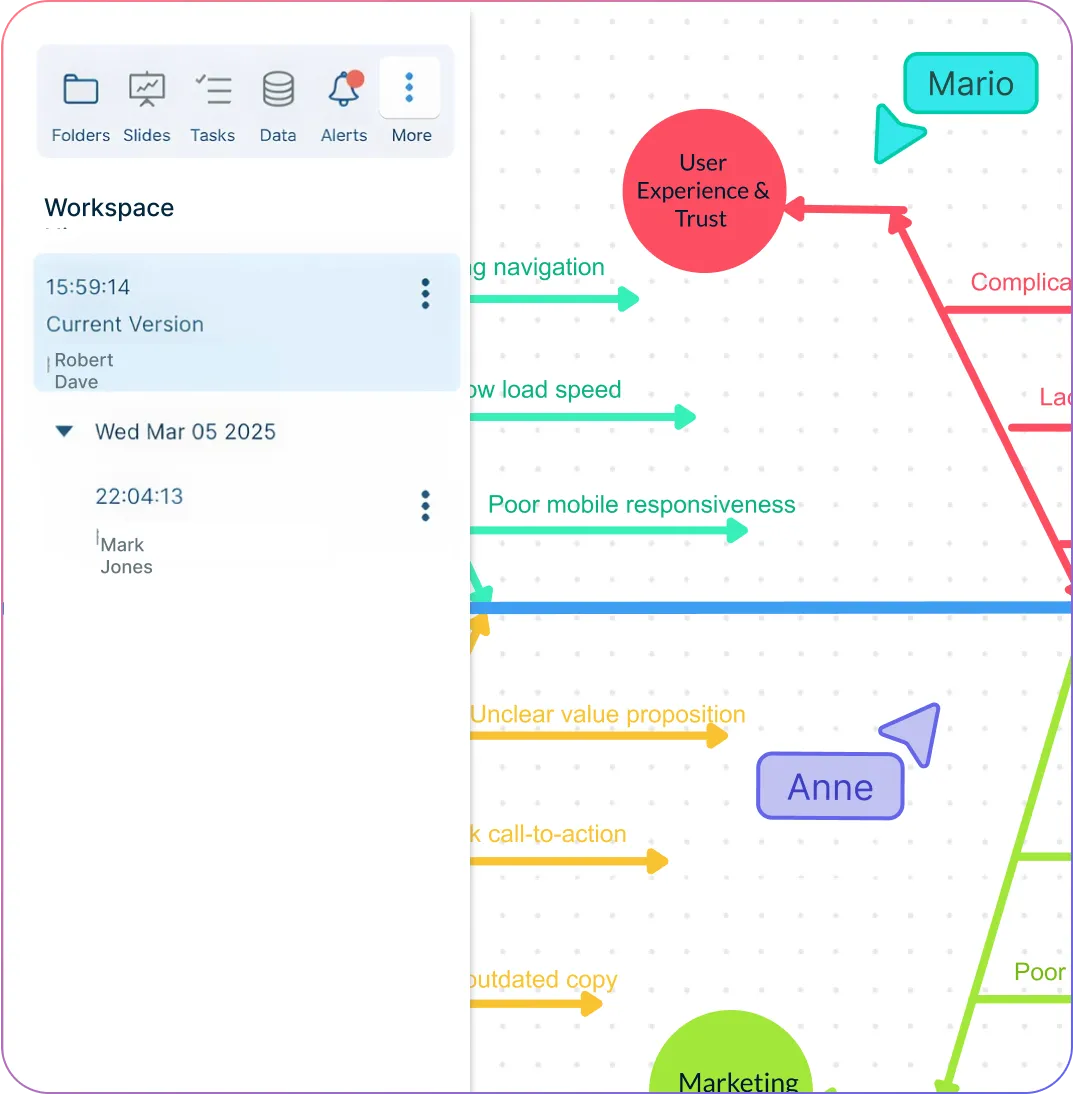
Review changes and revisit earlier ideas as new evidence or feedback becomes available.
Keep the Evidence Behind Every Possible Cause
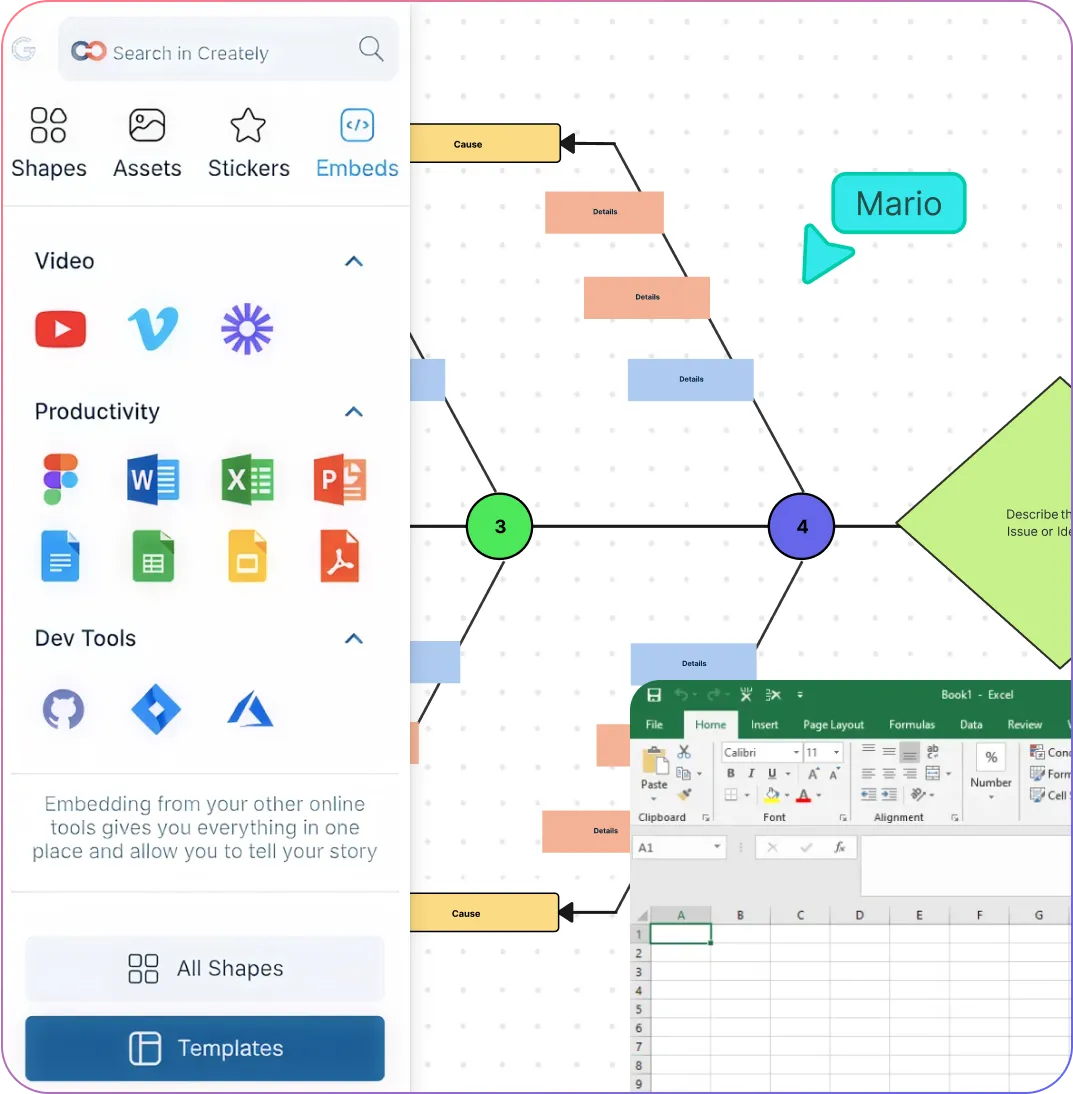
A short branch label may show what the cause is, but not why the team included it. Keep observations, reports, questions, and supporting material connected to the analysis so every finding has the context needed for review.
Add notes to explain possible causes, record assumptions, or highlight what still needs to be verified.
Attach reports, spreadsheets, images, links, and reference documents to the relevant branch.
Keep supporting details accessible without filling the diagram with long blocks of text.
Link process maps, flowcharts, mind maps, and other diagrams to build a connected problem-solving workflow.
Expand complex investigations across an infinite canvas while keeping the diagram easy to review.
Turn the Analysis Into the Next Step
A fishbone diagram should lead to a decision, not end as another document. Prioritize what needs further investigation, assign follow-up work, and share the findings with the people responsible for acting on them.
Highlight the causes that require validation, corrective action, or further investigation.
Connect findings to tasks or Kanban boards to assign owners and track follow-up work.
Present the analysis step by step using presentation frames for meetings and stakeholder reviews.
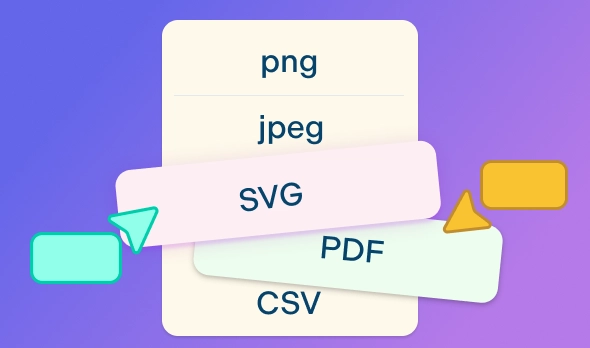
Export diagrams as PNG, SVG, or PDF, or share a live link to the latest version.
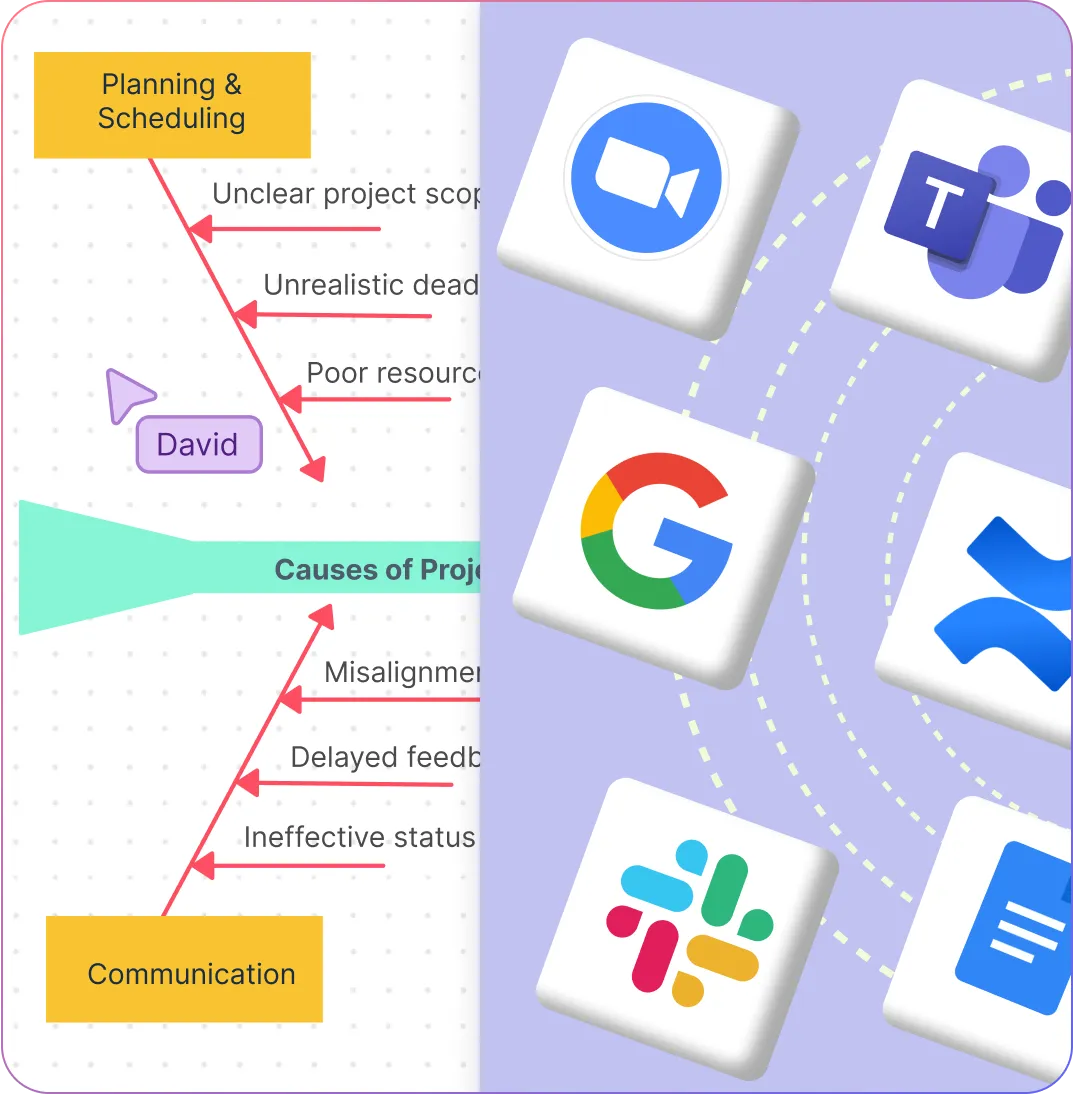
Embed diagrams in websites, wikis, or internal tools, and connect them with Confluence, Google Workspace, Slack, and other workplace apps.
What Can You Create With Creately’s Fishbone Diagram Creator?
Root-Cause Analysis Diagrams
Break recurring problems, defects, delays, complaints, or performance issues into possible causes and sub-causes. Use the diagram to guide discussion and determine where further investigation should begin.
6M Fishbone Diagrams
Investigate manufacturing and operational problems using Manpower, Methods, Machines, Materials, Measurement, and Mother Nature. Adapt the categories to match your production environment or process.
Service and Business Fishbone Diagrams
Analyze customer experience, service delivery, administrative, sales, or marketing problems using models such as the 4Ps, 4Ss, or 8Ps.
Manufacturing Cause-and-Effect Diagrams
Investigate production defects, equipment failures, waste, safety incidents, quality issues, or process delays while keeping evidence and observations connected to each possible cause.
Healthcare Fishbone Diagrams
Examine patient safety events, medication errors, communication gaps, workflow delays, and service-quality problems with input from clinicians, administrators, and care teams.
Project and Process Problem Analysis
Identify why a project or process is delayed, over budget, inconsistent, or failing to meet requirements. Organize causes around planning, people, resources, tools, communication, and dependencies.
Customer Service Analysis
Investigate complaints, missed requests, slow response times, and inconsistent service by comparing causes across people, systems, policies, processes, and workload.
Education and Classroom Diagrams
Help students explore cause-and-effect relationships or support educators investigating attendance, engagement, learning outcomes, and classroom challenges.
Create Your Fishbone Diagrams Using Editable Templates
FAQs About the Fishbone Diagram Generator
What are Creately’s fishbone diagram maker pricing plans?
- Free Plan — $0/month for basic fishbone diagram creation and collaboration
- Starter & Team Plans — $8/month or $5/month billed annually
- Business Plan — $149/month or $89/month billed annually
Annual billing helps you save more while unlocking advanced collaboration, workspace management, and enhanced fishbone diagram features. You can compare all available plans and features on the Creately Pricing Page.
How can you create fishbone diagrams faster?
Are there templates for different fishbone diagram use cases?
Can teams collaborate on fishbone diagrams?
Can I add notes, data, and files?
Can I share, present, or export fishbone diagrams?
What is a fishbone diagram?