Modern networks generate far more traffic inside their boundaries than at the edges, and that internal flow is where things often go wrong. This guide explains what East–West traffic is, where it shows up in data centers, microservices, Kubernetes, and cloud networks, and why visualizing it is critical for performance, security, and observability. You’ll see real-world examples, common challenges teams face, and how network diagrams can turn hidden internal traffic into something clear, shareable, and easier to manage.
What is East-West Traffic in Networking?
East–West traffic is the communication that happens inside your network between services, servers, containers, and databases, and it’s often the hardest part of modern architectures to understand. If you’ve ever wondered why something is slow, breaking, or failing silently, it’s usually because internal services are talking to each other in ways you can’t clearly see. This traffic powers microservices, cloud workloads, and container platforms, quietly moving data and requests behind the scenes while complexity keeps growing.
Learn how the traffic inside your network differs from traffic that flows in and out of your network in the East-West traffic vs North-South traffic guide.
Importance of Visualizing East-West Network Traffic
Network diagrams play a key role in visualizing East–West traffic for understanding system behavior, troubleshooting issues, and managing growing network complexity.
See what’s really happening inside your network — uncover hidden service-to-service communication that’s usually invisible but critical to performance.
Fix problems faster — quickly spot bottlenecks, failed dependencies, and unusual traffic paths without guessing.
Reduce security blind spots — clearly identify unexpected connections that could enable lateral movement or breaches.
Understand impact before things break — visualize how changes ripple across services so you can act with confidence.
Build systems that scale cleanly — keep growing architectures understandable, manageable, and easier to maintain.
Visualizing East West network traffic is most effective when your diagrams are clear, consistent, and easy to share across teams. With Creately’s network diagram software, you can map internal service flows using ready-made templates and collaborative visuals, so everyone understands how systems connect, where risks live, and what to improve next.
Examples of East-West Traffic in Networking
East–West network traffic shows up in many everyday networking scenarios, from on-prem data centers to cloud-native platforms. The examples below illustrate how internal, lateral communication works across different architectures, and how a network diagram can help make these hidden traffic flows easy to see and understand.
Data Center East-West Traffic
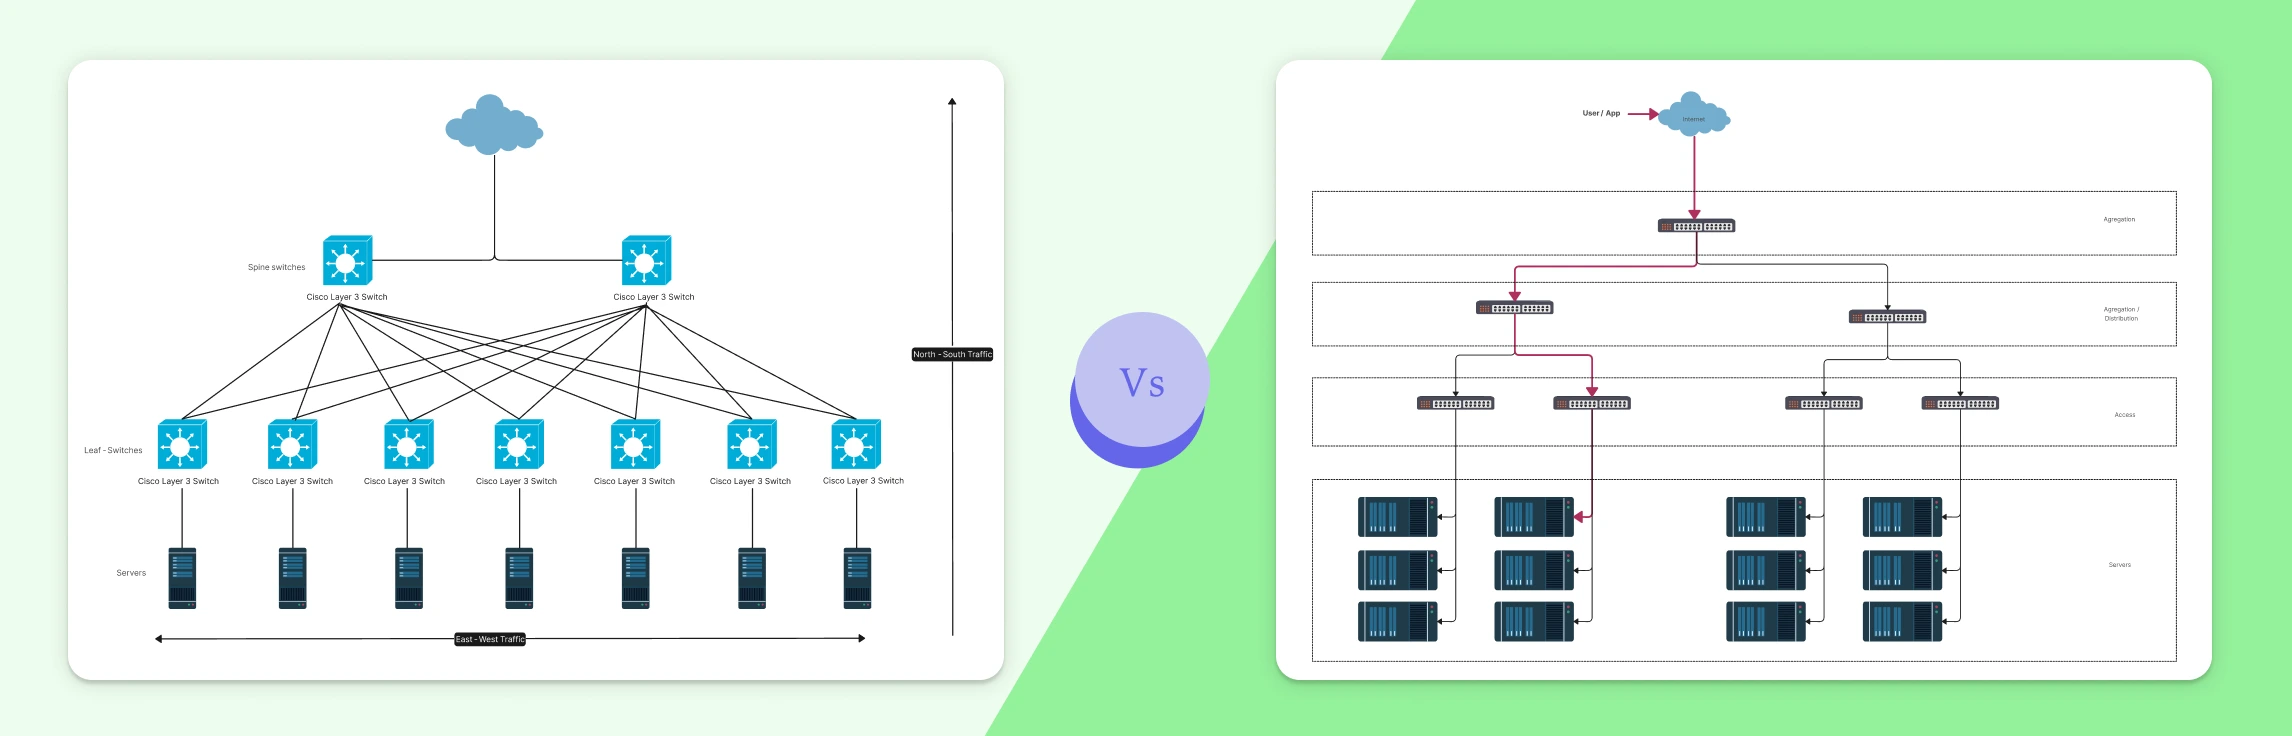
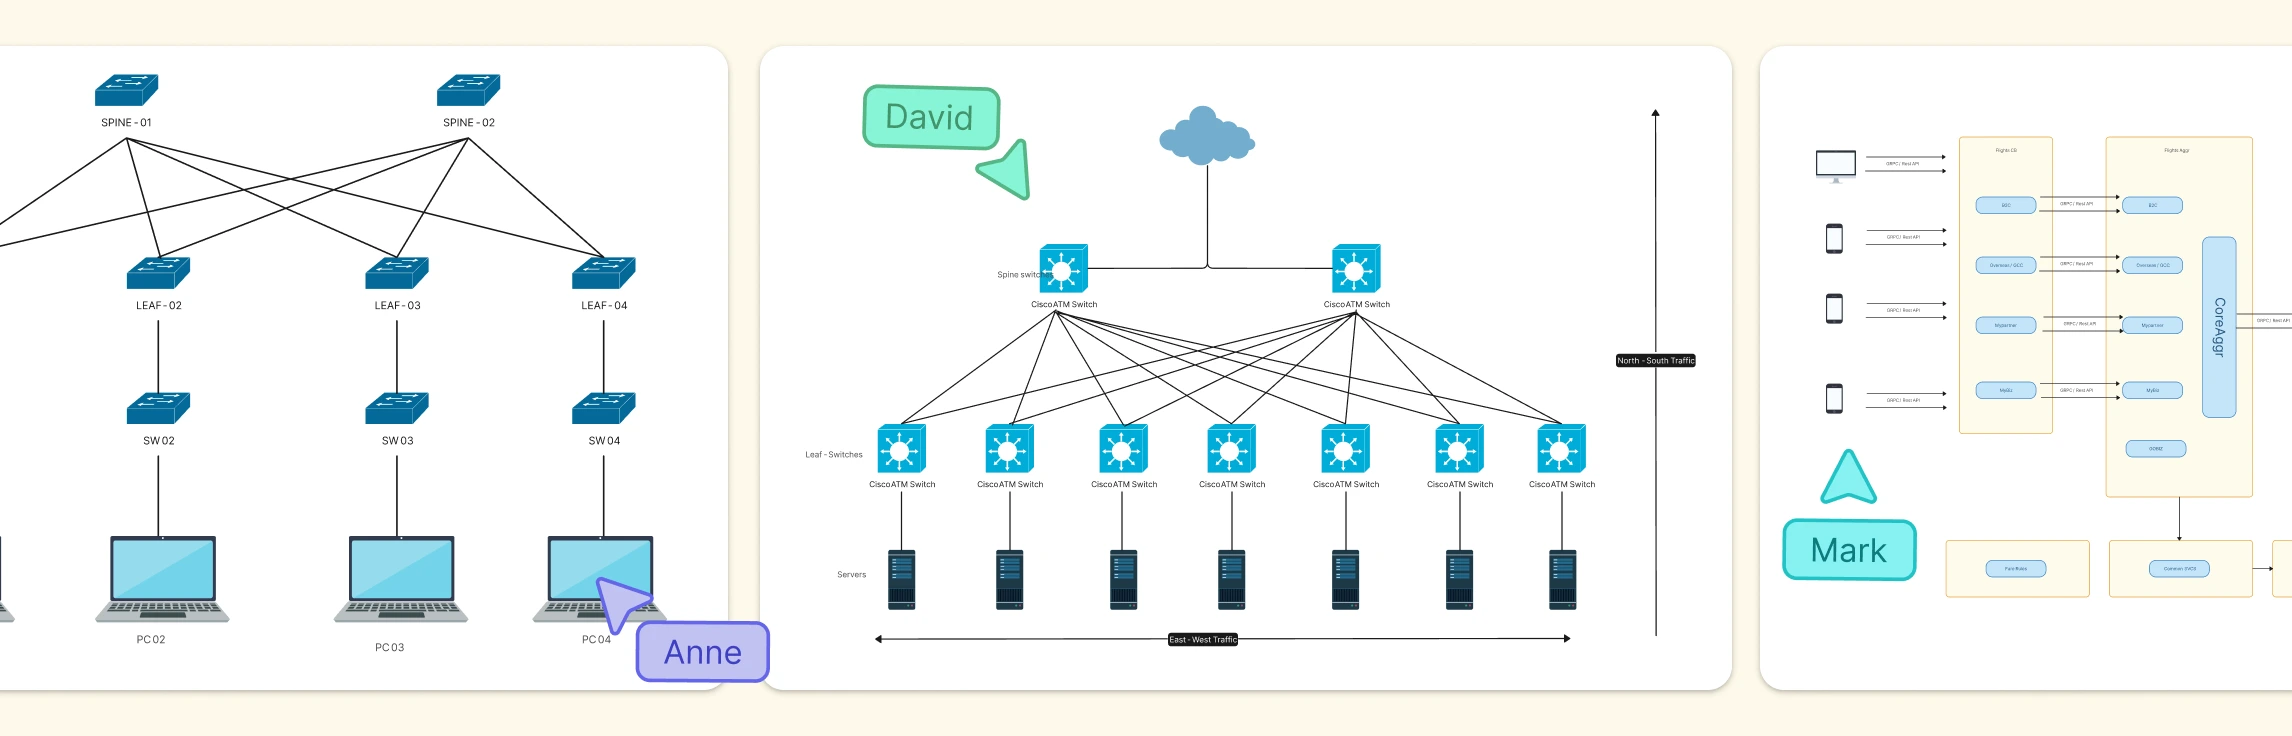
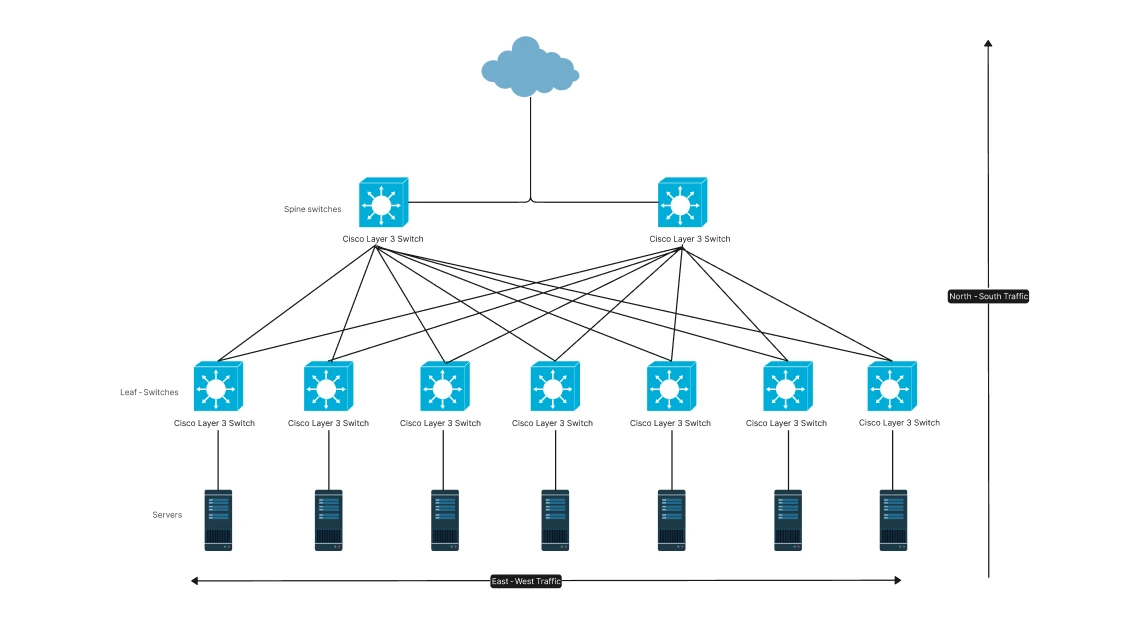
In a modern data center using a spine–leaf architecture, East West network traffic occurs when servers communicate with other servers across leaf and spine switches. For example, a web server on one rack may request data from an application or database server on another rack. This traffic moves laterally through leaf switches and across the spine layer, rather than entering or leaving the data center.


East-West Traffic in Microservices Architecture
In a microservices setup, a single user request triggers many internal service-to-service calls. A frontend service may talk to authentication, payments, and inventory services, with each interaction creating East–West network traffic inside the network. The microservices network diagram example shows how these independent, loosely coupled services communicate over internal networks using REST APIs, gRPC, or message brokers, making service dependencies and internal traffic flows easier to understand.

Kubernetes Pod-to-Pod Traffic
Inside a Kubernetes cluster, East West network traffic occurs when pods communicate with other pods or services across worker nodes. A frontend pod may call backend pods, which then talk to databases or queues, all without leaving the cluster. Kubernetes assigns each pod its own IP and uses Services to route traffic as pods scale or move, and visualizing these flows helps teams understand request paths, spot hidden dependencies, and troubleshoot performance issues more easily.

Cloud Virtual Network (Azure VNet)
In a cloud environment like Microsoft Azure, East–West network traffic occurs when resources communicate privately within a Virtual Network or across peered Virtual Networks. Application tiers, virtual machines, and managed services exchange data between subnets or VNets without going through the public internet. Azure Virtual Network provides the routing and built-in filtering needed to control this internal traffic, ensuring only expected and secure lateral communication happens between workloads.

Overcoming Observability Challenges in East–West Traffic with Network Diagrams
East–West network traffic introduces unique security and observability challenges because so much of it happens inside the network. The table below shows the most common issues teams face, and how network diagrams help bring clarity and control.
| Challenge | Why It’s a Problem | How Network Diagrams Help |
| Hidden internal traffic | East–West flows aren’t as visible as inbound or outbound traffic | Makes service-to-service and pod-to-pod communication paths easy to see |
| Lateral security movement | Internal services often trust each other too much | Reveals unexpected connections that increase attack surface |
| Constantly changing traffic paths | Autoscaling and dynamic routing change how requests flow | Provides a stable visual reference despite underlying changes |
| Difficult request tracing | Requests cross many internal hops | Maps end-to-end request paths for faster diagnosis |
| Limited shared understanding | Different teams rely on separate tools | Creates a common, visual model everyone can align on |
Explore how to draw a network diagram, to learn how to plan your network, identify the needed components, and start mapping your internal traffic paths. This will give your team the visibility they need to overcome East–West traffic observability challenges.
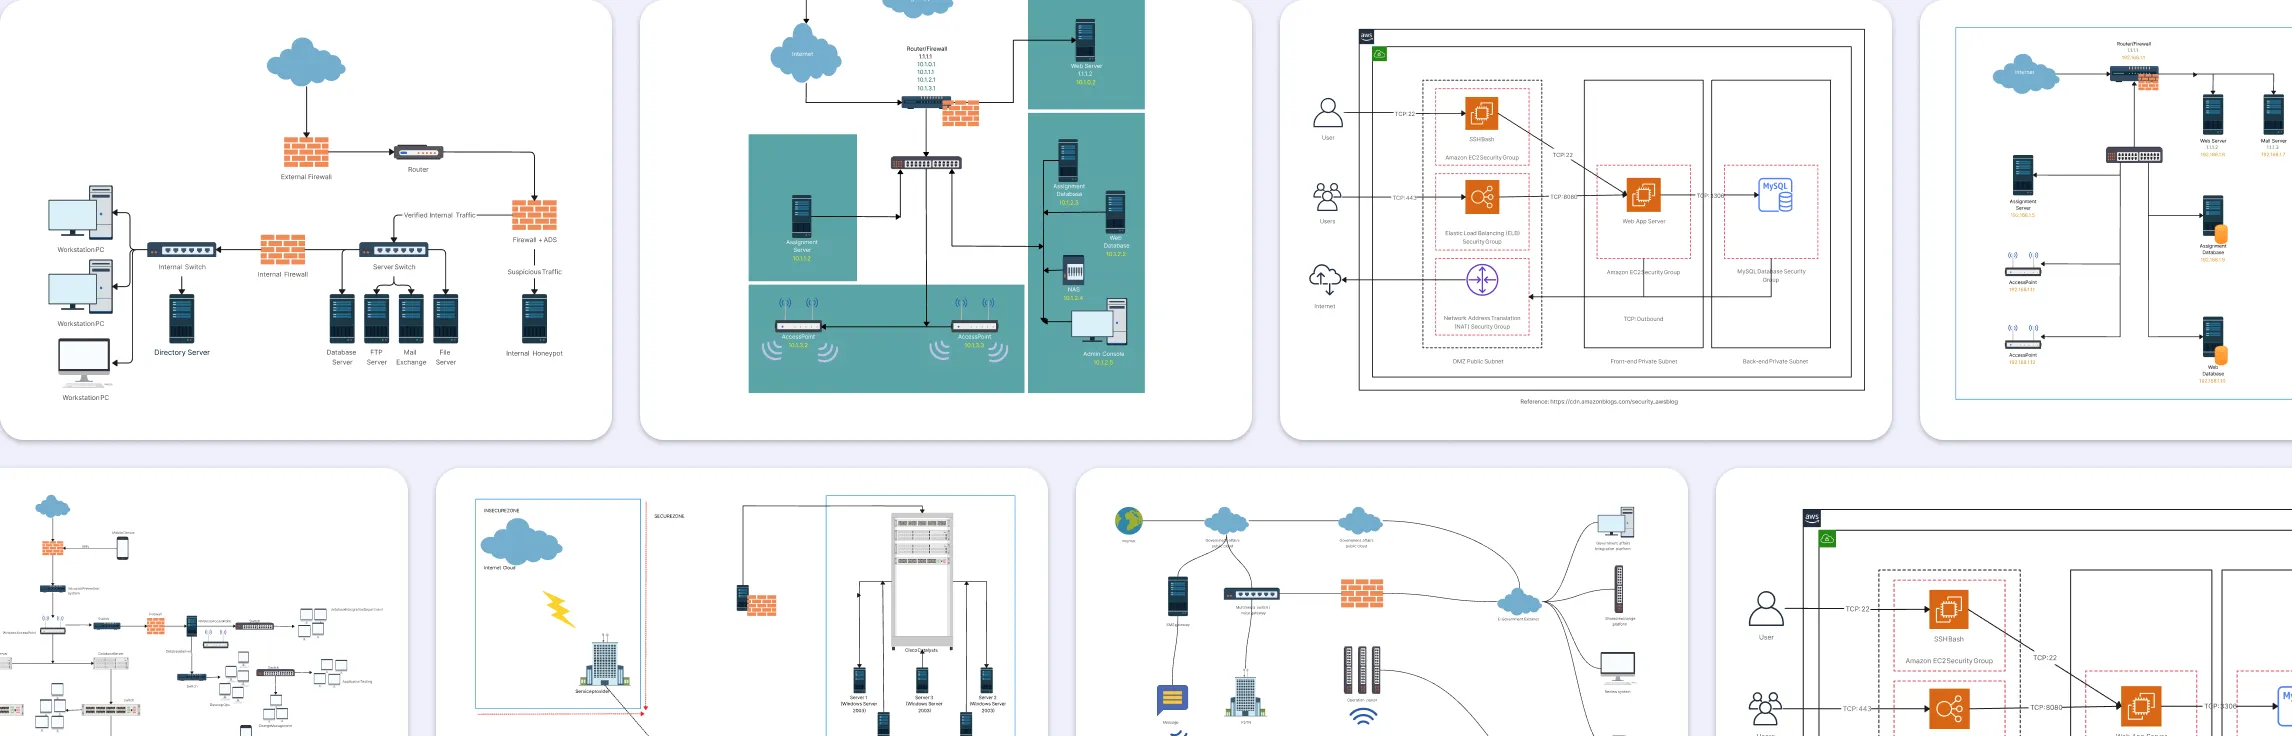
Free Network Diagram Templates to Get Started


Helpful Resources for Building Network Diagrams
Learn about the different types of network diagrams with examples.
Discover the different types of network topology and their use cases.
Learn about the Partial Mesh Network, why it's used, and real-world examples.
Discover different types of mesh topology examples for real-world use cases.
FAQs about East-West Traffic in Networking
What is East–West visibility?
How can teams improve visibility into East–West traffic?
How is East–West traffic different from North–South traffic?
What are East–West traffic security risks?
What is an East West Firewall?
Resources
George, et al. “Innovative Traffic Management for Enhanced Cybersecurity in Modern Network Environments.” Partners Universal International Research Journal, vol. 3, no. 4, 2024, pp. 1–13, https://doi.org/10.5281/zenodo.14480018.
Rahman, Mohammad Naimur, and Amir Esmailpour. “A Hybrid Data Center Architecture for Big Data.” Big Data Research, vol. 3, Apr. 2016, pp. 29–40, https://doi.org/10.1016/j.bdr.2016.02.001.