In an increasingly complex world, managing risks and ensuring safety are critical for businesses across all industries. Event Tree Analysis (ETA) is a systematic and powerful method for evaluating the outcomes of initiating events and understanding potential risks by visually mapping possible scenarios and their probabilities. For professionals responsible for risk assessment, safety management, or compliance, mastering Event Tree Analysis is a valuable skill. This guide not only explains the fundamentals of ETA but also shows how tools like Creately make the process efficient and collaborative, ensuring that teams can focus on delivering better safety outcomes.
What Is Event Tree Analysis?
Event Tree Analysis (ETA) is a forward-looking risk analysis method that starts with an initiating event and maps what can happen next as safety barriers succeed or fail. It’s used to model escalation pathways and end states, helping teams compare how different controls change the likelihood of specific outcomes. ETA is especially useful when you want a structured view of “what happens next” rather than “what caused it.”
In practical terms, ETA answers:
“Given that an initiating event has occurred, what are the possible outcomes, and how likely is each outcome?”
By assigning probabilities to each branch, ETA can estimate path likelihoods and scenario frequencies to highlight which barriers drive risk.
Typical ETA inputs
- Initiating event definition (scope + time window)
- Barriers/safety functions
- Clear success/failure criteria
- Conditional probabilities for each branch
What ETA produces (outputs)
- Scenario paths and end states
- Path probabilities
- Scenario frequencies
- Insight into which barriers drive risk


How to Perform an Event Tree Analysis
Event tree analysis is a structured way to assess risk by charting all plausible outcomes from an initiating event. Use the steps below to build a tree you can quantify and interpret consistently.
Step 1: System Definition
Define the system or process being analyzed (boundaries, components, interfaces, and operating assumptions). A clear definition keeps the analysis focused and prevents missing critical contributors.
Step 2: Identify Initiating Events
Initiating events define the starting point and scope of the analysis (equipment failures, human errors, external disturbances). Specify each initiating event precisely so it can be analyzed consistently.
Make the initiating event measurable. For each initiating event, document:
- System boundary: what equipment/interfaces are in scope
- Operating mode: startup/shutdown/normal/maintenance
- Time window: the exposure duration you’re modeling
- Initiating event frequency/rate: ideally per year (or per demand), based on plant data, industry data, or expert elicitation
Step 3: Develop the Event Tree
Construct the tree to map how outcomes unfold through successive barrier responses. Each branch represents success or failure of a barrier/safety function, creating distinct paths that end in defined end states.
Define barrier branches explicitly. For each barrier/safety function, define:
- What counts as success (including time limits)
- What counts as failure (fails to start, fails to run, late response, human action not completed)
- Whether barriers are independent or share common dependencies (power, sensors, utilities, staffing)
Step 4: Assign Probabilities
Assign probabilities to each branch to quantify how likely different pathways are. ETA is typically quantified using conditional probabilities at each branch.
- Assign
P(success | prior outcomes)andP(failure | prior outcomes)for each barrier. - Path probability:
P(path) = product of branch probabilities along that path - If
F_initis the initiating event frequency, scenario frequency is:F_scenario = F_init × P(path)
Avoid assuming independence by default—shared utilities, shared instruments, and common-cause failures can make branch probabilities conditional.
Step 5: Analyze, Interpret, and Evaluate Outcomes
With the event tree in place and probabilities assigned, evaluate each path by considering both likelihood (probability/frequency) and consequence (severity/impact). This turns the tree from a diagram into a decision tool.
Once you compute scenario probabilities/frequencies, use the tree to:
- Identify dominant risk contributors (paths that combine high frequency and high consequence)
- Compare risk reduction options (e.g., improving a barrier’s success probability vs adding a new independent barrier)
- Validate control strategy coverage (which layers are prevention-focused vs mitigation-focused, and where gaps exist)
This interpretation step helps you prioritize which risks need immediate attention and which controls offer the highest leverage for reducing overall risk.
Step 6: Document and Review
Document initiating events, tree structure, probability assumptions, and results. Review and update the analysis as the system, operations, or data changes.
By following these steps, Event Tree Analysis helps teams quantify outcome pathways, compare barrier effectiveness, and focus improvements on the controls that drive risk.
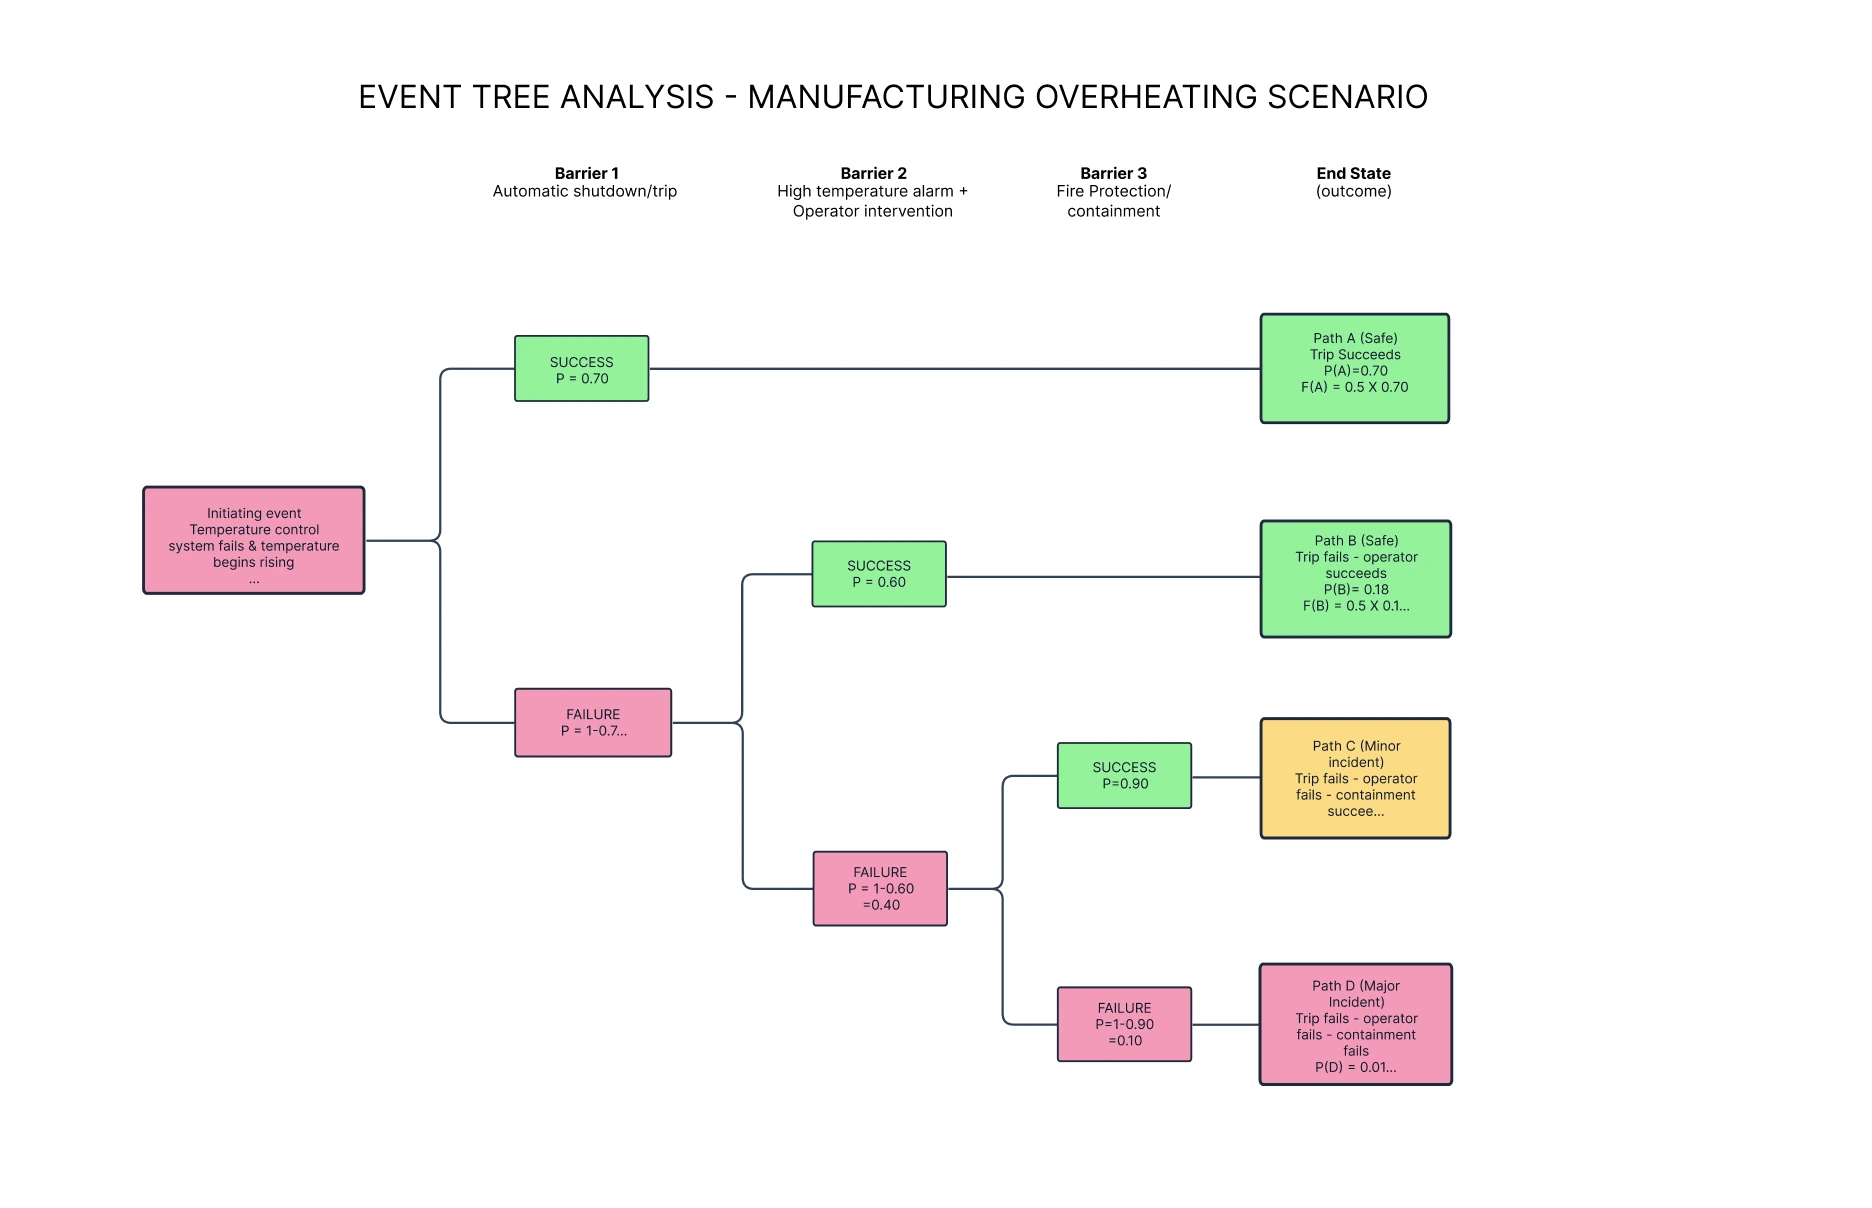
Event Tree Analysis Example (Manufacturing Overheating Scenario)
Let’s consider a practical scenario where ETA is commonly used: a manufacturing company running a production line with automated machinery. One key risk is temperature control failure, which can lead to overheating and (in the worst case) a fire.
ETA is a good fit here because the question is: given that the initiating failure has happened (temperature control failure), what happens next depending on whether barriers work? In other words, ETA helps you compare downstream outcomes based on barrier success/failure. If your goal is to analyze why temperature control fails in the first place (sensor faults, controller logic, wiring, maintenance errors), you’d typically use Fault Tree Analysis (FTA) or FMEA upstream.
Scenario Setup
- System: Production equipment with automated temperature control
- Initiating event: Temperature control system fails and temperature begins rising
- Initiating event frequency:
F_init = 0.5 / year(illustrative)
Barriers and Success/Failure Criteria
Model the response as barrier success/failure branches:
Barrier 1: Automatic shutdown / trip
- Success: Trip activates within the required time window and stops heating/energy input
- Failure: Trip fails to activate or activates too late
Barrier 2: High-temperature alarm + operator intervention
- Success: Alarm is raised and the operator takes the required action in time (manual stop/isolation)
- Failure: Alarm not raised, missed, or operator action not completed in time
Barrier 3: Fire protection / containment
- Success: Any overheating/fire is contained and does not escalate beyond local damage
- Failure: Protection is ineffective and the event escalates (major damage/fire hazard)
Assign Branch Probabilities (Illustrative)
P(Trip succeeds) = 0.70P(Operator succeeds | Trip fails) = 0.60P(Containment succeeds | Trip fails ∩ Operator fails) = 0.90
Calculate Path Probabilities and Scenario Frequencies
Use:
- Path probability: multiply branch probabilities along the path
- Scenario frequency:
F_scenario = F_init × P(path)
Path A (Safe): Trip succeeds
P(A) = 0.70F(A) = 0.5 × 0.70 = 0.35 / year
Path B (Safe): Trip fails → Operator succeeds
P(B) = (1 - 0.70) × 0.60 = 0.18F(B) = 0.5 × 0.18 = 0.09 / year
Path C (Minor incident): Trip fails → Operator fails → Containment succeeds
P(C) = 0.30 × 0.40 × 0.90 = 0.108F(C) = 0.5 × 0.108 = 0.054 / year
Path D (Major incident): Trip fails → Operator fails → Containment fails
P(D) = 0.30 × 0.40 × 0.10 = 0.012F(D) = 0.5 × 0.012 = 0.006 / year
What This Example Tells You
- The “major incident” path (D) is low frequency, but it’s the one you typically target because consequences are high.
- The tree shows the critical combination: trip failure + delayed/failed operator response increases reliance on containment.
- If you need to reduce severe-outcome frequency, compare options like improving trip reliability, improving alarm response/time-to-act, or adding a more independent protection layer.
- This is an ETA-style decision because it compares outcomes conditional on barrier success/failure (FTA is better for analyzing why the initiating event happens).
Who Uses Event Tree Analysis
Event Tree Analysis is used by safety and risk teams to model “what happens next” after an initiating event and to test whether prevention and mitigation layers are sufficient. It’s widely applied in safety‑critical industries to identify high‑consequence paths and improve barrier effectiveness. Here are some common examples by sector.
Healthcare
Hospitals and medical facilities use event tree analysis to assess risks associated with patient care, such as equipment malfunctions, medication errors, or emergency response delays. By understanding potential outcomes, healthcare providers can refine procedures and improve patient safety.
Oil and Gas Industry
The oil and gas industry uses event tree analysis to evaluate risks in exploration, drilling, and transportation processes. For example, it can analyze the consequences of equipment failures, gas leaks, or pipeline ruptures, enabling companies to develop robust emergency response plans.
Environmental Auditing
Event Tree Analysis plays a pivotal role in environmental auditing by evaluating potential risks associated with pollution, resource depletion, or hazardous waste management. For example, ETA can assess the consequences of a spill in a water body, exploring outcomes such as containment success, cleanup delays, or long-term ecological damage. This structured approach helps organizations identify vulnerabilities, implement effective mitigation strategies, and ensure compliance with environmental regulations, promoting sustainable and responsible operations.
Transportation
Railways, shipping, and road transport sectors leverage event tree analysis to evaluate risks related to collisions, infrastructure failures, or weather-related disruptions. By predicting outcomes, operators can enhance safety protocols and reduce accidents.
Chemical Industry
Event tree analysis is critical for assessing the risks of chemical reactions, storage failures, or equipment malfunctions. It aids in the development of containment strategies and emergency plans to mitigate hazardous incidents.
Energy Production
Renewable energy sectors, such as wind and solar, also use event tree analysis to model risks associated with equipment failures, grid disruptions, or extreme weather events. These insights help ensure continuous energy supply and system reliability.
Aerospace
In aerospace, event tree analysis is vital for assessing risks associated with aircraft operations. By simulating accident scenarios, engineers can design customized preventive measures, ensuring passenger and crew safety while maintaining regulatory compliance.
Nuclear Power
The nuclear power sector relies on event tree analysis to model potential failure pathways that could lead to critical incidents, such as reactor malfunctions or radiation leaks. These insights guide the development of safety protocols to prevent catastrophic outcomes, protecting both the environment and human lives.
Manufacturing
In manufacturing, event tree analysis helps identify potential equipment failures or process bottlenecks. By analyzing these scenarios, companies can implement strategic maintenance schedules, reduce unplanned downtime, and improve overall productivity.
These ETA examples demonstrate the versatility and effectiveness of the technique in addressing complex safety challenges. Each industry tailors event tree analysis to its unique requirements, enabling informed decision-making and fostering a culture of safety and reliability.
Benefits of Event Tree Analysis
Event tree analysis offers numerous benefits, making it an essential tool for risk management and safety planning across industries. Here are some key advantages:
1. Proactive Risk Identification
Event tree analysis helps organizations identify potential risks and their outcomes before they occur, allowing for proactive measures to mitigate threats.
2. Improved Decision-Making
By visualizing the potential outcomes of an initiating event, event tree analysis provides a clear framework for decision-makers to evaluate risks and prioritize safety measures effectively.
3. Enhanced Safety and Compliance
Event tree analysis ensures that safety protocols are robust by identifying vulnerabilities in existing systems, helping organizations comply with industry safety standards and regulations.
4. Cost-Effective Risk Management
By predicting and addressing potential failures, event tree analysis reduces the likelihood of costly incidents, saving resources on reactive solutions.
5. Supports Continuous Improvement
The insights gained from event tree analysis can be integrated into organizational processes to drive ongoing safety improvements and operational efficiency.
With its ability to systematically evaluate risks and outcomes, event tree analysis empowers businesses to safeguard their operations while optimizing safety strategies.
Why Use Creately for Event Tree Analysis
Event Tree Analysis gets complex quickly—especially when you’re branching multiple barriers and tracking assumptions. Creately helps teams build, review, and maintain event trees without starting from scratch.
- ETA templates: Start from proven event-tree layouts and customize for your scenario
- Clear branching structure: Model barrier success/failure paths and end states in a readable format
- Attach assumptions: Add notes/links for probability inputs, data sources, and rationale
- Collaboration + review: Co-edit with safety/risk stakeholders and capture feedback in one place
- Shareable outputs: Export or embed diagrams for reports, audits, and presentations
Event Tree Analysis Templates to Get Started


Helpful Resources
Uncover potential system failures, analyze their causes, and develop preventive measures.
Explore the methodology, tools, and applications of FTA to transform failure scenarios into manageable solutions.
Discover how to identify potential threats, visualize risks, prioritize actions, and allocate resources efficiently.
Gather information about potential risks and vulnerabilities within an organization to systematically evaluate various risks.
Event Tree Analysis (ETA) vs Fault Tree Analysis (FTA)
Event Tree Analysis (ETA) and Fault Tree Analysis (FTA) are often used together, but they answer different questions:
- ETA: “Given this initiating event, what outcomes can follow—and how likely is each?”
- FTA: “What failures (and combinations of failures) could cause this top event?”
| Aspect | Event Tree Analysis (ETA) | Fault Tree Analysis (FTA) |
|---|---|---|
| Direction | Forward (initiating event → outcomes) | Backward (top event → causes) |
| Best for | Consequence modeling, escalation pathways, barrier success/failure logic | Root-cause logic, identifying combinations of failures that can produce a top event |
| Starting point | Initiating event (with a frequency/rate) | Defined top event (undesired outcome) |
| What the branches represent | Barrier/safety function success vs failure | Logical combinations of causes (AND/OR relationships) |
| Typical outputs | Scenario paths, end states, path probabilities, scenario frequencies | Minimal cut sets, importance of contributors, probability of top event |
| How probabilities are used | Conditional probabilities on branches; path probability is a product of branch terms | Component/basic event failure probabilities combined via Boolean logic |
| Where assumptions matter most | Barrier independence/dependencies, common-cause failures, response time windows | Completeness of cause modeling, gate structure accuracy, dependence/common cause |
| When ETA is preferable | You need to compare how outcomes change when barriers succeed/fail (e.g., trip works vs operator response vs containment) | You need to understand why the initiating event/top event happens and what to prevent upstream |
| How they work together | Use FTA to estimate the initiating event frequency or barrier failure probability, then feed into ETA | Use ETA to explore consequence outcomes after the top/initiating event identified in FTA |
Practical Rule of Thumb
If your decision is about which barrier improvements reduce severe outcomes most, start with ETA.
If your decision is about which causes to remove to prevent the initiating/top event, start with FTA.
Common Mistakes in Event Tree Analysis (And How to Avoid Them)
- Unclear barrier success criteria: Define what “success” means (time limit, performance threshold, completion criteria).
- Accidental independence assumptions: Shared utilities, shared sensors, and shared human actions create dependencies—use conditional probabilities.
- Mixing probabilities and frequencies: Use probabilities for branches; use initiating event frequency to compute scenario frequencies.
- Inconsistent time windows: A “success” probability must match the time horizon you’re analyzing.
- Outcome definitions that are too vague: End states should be specific enough to support decisions (safe shutdown vs controlled release vs major loss of containment).
Wrapping Up: Elevate Your Risk Management with ETA
Event Tree Analysis helps organizations identify risks, evaluate potential outcomes, and improve safety and decision-making across complex systems. Industries from aerospace to manufacturing use ETA to assess barrier effectiveness and reduce high-consequence risks. Creately makes Event Tree Analysis easier with ready-made templates, customizable diagrams, and real-time collaboration tools that help teams build, review, and share ETA workflows efficiently.
FAQs about Event Tree Analysis
What is the purpose of Event Tree Analysis (ETA)?
What industries commonly use Event Tree Analysis?
How is Event Tree Analysis different from Fault Tree Analysis?
How does Creately simplify the creation of Event Tree Analysis diagrams?
What is an initiating event in Event Tree Analysis?
How do you calculate event tree probability and frequency?
What is a failure event in Event Tree Analysis?
Resources
Andrews, J.D. and Dunnett, S.J. (2000). Event-tree analysis using binary decision diagrams. IEEE Transactions on Reliability, 49(2), pp.230–238. doi:https://doi.org/10.1109/24.877343.
Ferdous, R., Khan, F., Sadiq, R., Amyotte, P. and Veitch, B. (2009). Handling data uncertainties in event tree analysis. Process Safety and Environmental Protection, 87(5), pp.283–292. doi:https://doi.org/10.1016/j.psep.2009.07.003.
Standards and Guidance
ISO/IEC 31010:2019. Risk management — Risk assessment techniques (includes Event Tree Analysis and Fault Tree Analysis among recognized risk assessment techniques).
INTERNATIONAL ATOMIC ENERGY AGENCY (2024). Development and Application of Level 1 Probabilistic Safety Assessment for Nuclear Power Plants (IAEA Safety Standards Series No. SSG-3 (Rev. 1)). doi:https://doi.org/10.61092/iaea.3ezv-lp49.
U.S. Nuclear Regulatory Commission (NRC). “Event tree” glossary entry and PRA guidance: https://www.nrc.gov/reading-rm/basic-ref/glossary/event-tree.