A network diagram is a visual representation of system components—such as devices, servers, and applications—and how they’re connected. It shows how data, traffic, or dependencies flow across a network, making complex systems easier to understand at a glance. In this guide, you’ll learn how to draw a network diagram step by step, from planning what to include to laying out components clearly and choosing the right symbols.
Planning Your Network Diagram
Before you start dragging icons and drawing lines, great network diagrams begin with clear planning. This phase helps you figure out what to include, why you’re drawing a network diagram, and how detailed your diagram should be. A focused plan makes the diagram actually useful for your audience.
1. Identify the type of network to diagram
The first step is understanding what type of network you’re working with. Different networks require different diagram approaches and levels of detail.
Ask yourself:
Is this a local area network (LAN) within an office or building?
A wide area network (WAN) connecting multiple locations?
A wireless network, cloud-based setup, or hybrid environment?
A data center, enterprise network, or home network?
Identifying the network type helps determine what components to include, how connections should be represented, and which topology makes the most sense. For example, a cloud network diagram focuses more on virtual services and connectivity, while a LAN diagram highlights physical devices and switches.
2. Identify network components
Next, make a list of everything that should be in the diagram.
This means writing down all devices and pieces that make up your network:
routers, switches, firewalls
servers, workstations, printers
wireless access points, IoT devices
links and connections between them
You’re basically inventorying every node and connection that belongs in your network story. A clear component list prevents overlooked parts and makes your diagram accurate and trustworthy. This also includes network services like VLANs or special segments that you might want to show later.
3. Determine level of detail
Now decide how detailed your diagram should be.
There are two broad approaches:
High-level diagrams: These give an overview of the network without too much clutter. They’re ideal when you want to show big picture infrastructure — think “internet → edge router → core switch → offices” — without listing every single workstation.
Detailed diagrams: These zoom in on every device and connection, including IP addresses, subnet information, model names, and even VLAN assignments. These are useful for engineers doing configuration work or troubleshooting specific issues.
Choose high-level diagrams when you want clarity and simplicity. Choose detailed diagrams when every piece of the puzzle matters.
4. Choose appropriate topology to reflect structure
Finally in planning, decide on the network topology that matches how your network is built and how you want to show it.
Network topology means how devices are arranged and connected. There are common patterns that help you organize your diagram and communicate structure clearly:
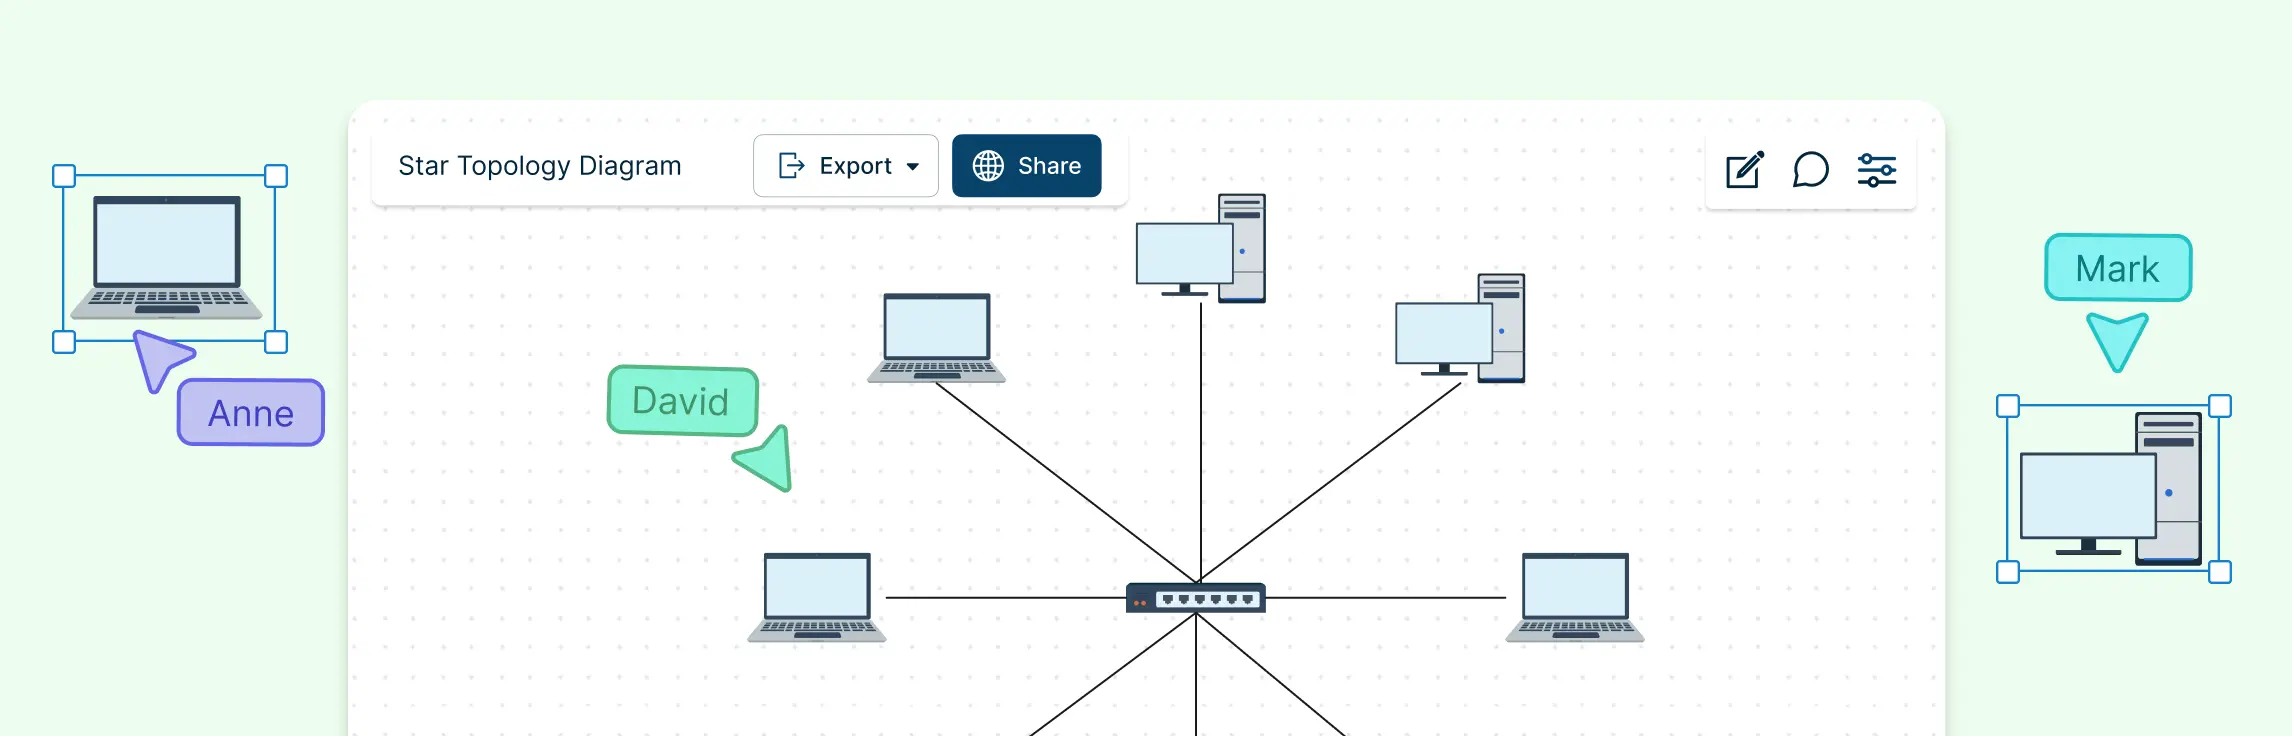
Star topology — all devices connect to a central hub or switch. It’s simple and easy to follow on a diagram.
Bus topology — devices share a single backbone cable. It’s more historic, but useful in small layouts.
Ring topology — devices connect in a loop, where each device links to two neighbors.
Mesh topology — every device connects to many or all others. This gives redundancy but can be complex.
Tree topology — a hierarchical mix of star and bus where networks branch out like a tree.
Choosing the right topology helps viewers immediately understand the shape of your network. It also influences how you place and connect components on the page so the layout stays intuitive and clear.
How to Create Network Diagram
Once you’ve planned your network diagram, it’s time to bring it to life. Think of this as a practical workflow that takes you from idea to polished visual. Whether you’re doing this on paper or using a digital tool, these steps will keep your work organized and clear.
Step 1: Choose a diagramming tool (start here)
Before you draw anything digitally, pick the right tool. A good diagramming tool helps you work faster, keeps everything neat, and makes collaboration easy.
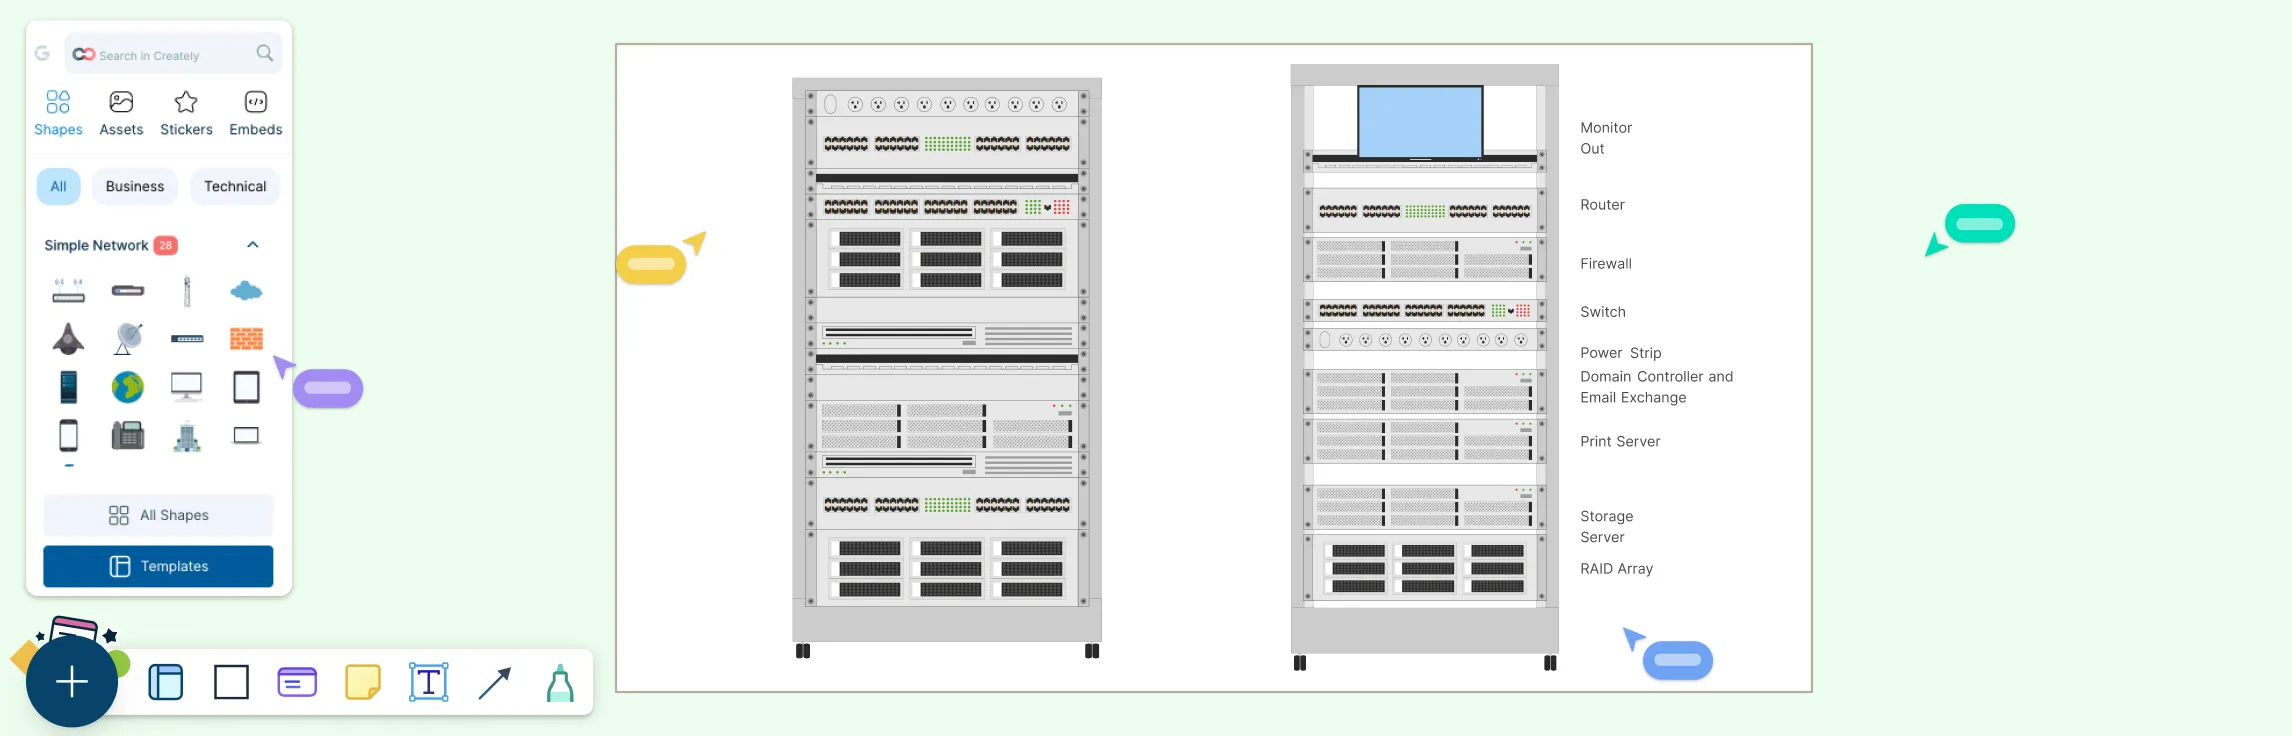
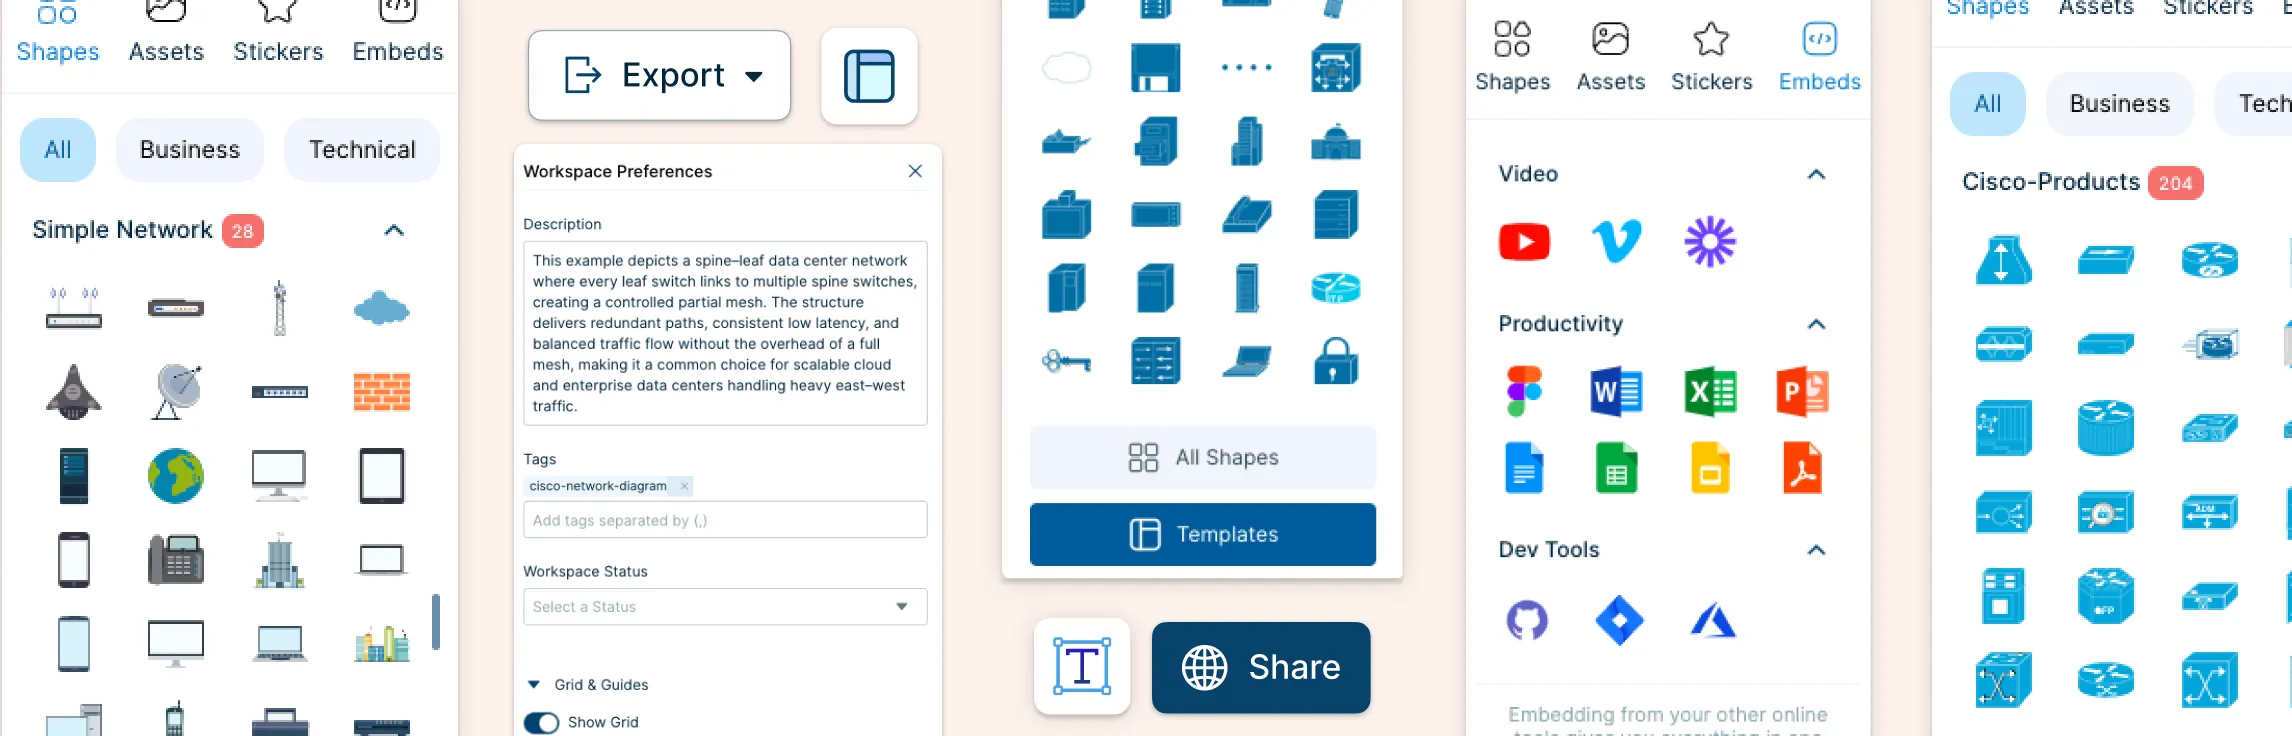
Creately is a great choice for network diagrams because it has:
Vast libraries of network symbols and icons for routers, switches, servers, clouds, and more — so you don’t have to draw every shape from scratch.
Pre-built network diagram templates to help you start quickly.
Drag-and-drop editing that makes arranging components effortless.
Collaboration features so teams can work together in real time — perfect when documenting systems or planning with others.
Data fields and notes attached to shapes for adding details like IP addresses or VLAN info.
Once you’ve chosen your tool, you can move from sketching to a polished diagram.
Step 2: Start with a rough sketch
Begin with a quick rough sketch—either on paper, a whiteboard or on Creately with the help of its freehand drawing tool. This helps you sort out layout ideas without worrying about neat lines or icons. A sketch lets you play with where devices go and how they connect. This early step is all about thinking of the big picture. You’re not aiming for perfection—just capturing your network’s core structure.
Step 3: Place network components (nodes)
Now bring your design to life by placing all the key components—these are your nodes:
Routers, switches, firewalls
Servers, workstations
Wireless access points
Any device that sends or receives traffic
Arrange these devices in functional layers:
Core devices at the top
Distribution devices in the middle
End devices at the bottom
Organizing this way makes your diagram easier to understand at a glance and mirrors how network teams think about traffic flow and architecture.
Step 4: Connect the elements
Once components are laid out, draw lines and arrows to show relationships and traffic flow. Use connectors to show:
How devices link
Which paths data travels
Whether connections are one-way or two-way
Clear connection lines with arrows help anyone reading the diagram follow network flows easily.
Step 5: Label everything clearly
Good labeling turns a diagram from pretty to practical. Add clear text for:
Device names
IP addresses
VLAN IDs
Interface labels (if needed)
The level of labeling depends on how detailed your diagram is, but make sure everything essential has a clear label. Avoid clutter by using concise text and placing labels neatly near the shapes they describe.
Step 6: Use color, spacing, and direction to reduce clutter
Visual clarity matters! Use color coding, spacing, and directional flow to make your network diagram easy to read:
Color: Use different colors to separate device types or different network segments
Spacing: Leave room between components so lines don’t overlap
Direction: Align your diagram so connections flow in a logical direction (left-to-right or top-to-bottom)
These visual choices reduce clutter and help viewers absorb information quickly.
Step 7: Finalize and review
You’re almost done! Now it’s time to review and polish:
Check that all connections reflect reality
Verify labels are accurate
Make sure symbols are consistent
Adjust spacing so nothing overlaps or feels cramped
A clean final pass ensures your network diagram is not just correct, but also easy for others (and future you!) to understand.
Best Practices and Design Principles for Creating Network Diagrams
Now that you know how to build a network diagram, follow these best practices to ensure your diagram is a tool that actually helps you and your team, rather than causing confusion.
1. Clarity matters
Clarity is king. A network diagram should communicate the structure and flow at a glance. Avoid:
Crossing lines that make it hard to follow connections
Cluttered layouts that cram too many components together
Organize your diagram so connections are straight, lines don’t overlap unnecessarily, and the flow of the network is intuitive. Use logical layering—core devices at the top, distribution devices in the middle, and end devices at the bottom—to make the structure immediately understandable. Clear diagrams save time, reduce errors, and make troubleshooting faster.
2. Utilize Symbols and Icons
Using standardized symbols and icons improves readability and ensures everyone interprets the diagram the same way.
Use universally recognized icons for routers, switches, servers, firewalls, and workstations
Keep symbols consistent across all diagrams and layers
Avoid mixing different styles or hand-drawn elements
Symbols allow information to be conveyed visually and efficiently, helping teams quickly understand the network at a glance.
3. Apply Color Coding and Grouping
Color coding is a powerful way to differentiate between device types, network segments, or connection types. Combine this with grouping and whitespace to make large diagrams easier to follow:
Group devices by function, location, or department
Use whitespace strategically to separate sections and reduce clutter
Apply colors sparingly to highlight important areas or indicate different types of connections
Together, grouping, spacing, and color coding make diagrams more readable and help viewers focus on the most important information.
4. Create Layers for Complexity
For complex networks, layering can help manage information without overwhelming the viewer:
High-level layers can show overall topology or major components
Detailed layers can include IP addresses, VLANs, and device-specific connections
Layered diagrams allow you to present complexity gradually, making them easier to understand
This approach ensures your diagram remains organized and accessible, no matter how large or intricate the network.
5. Version Control and Update Logs
Networks evolve, and your diagrams should too. Keep them current and reliable by:
Dating diagrams and including version numbers
Logging updates to track changes over time
Storing diagrams in a shared location for easy team access
Version control transforms your diagram from a static snapshot into a living, dependable document that supports audits, training, troubleshooting, and planning.
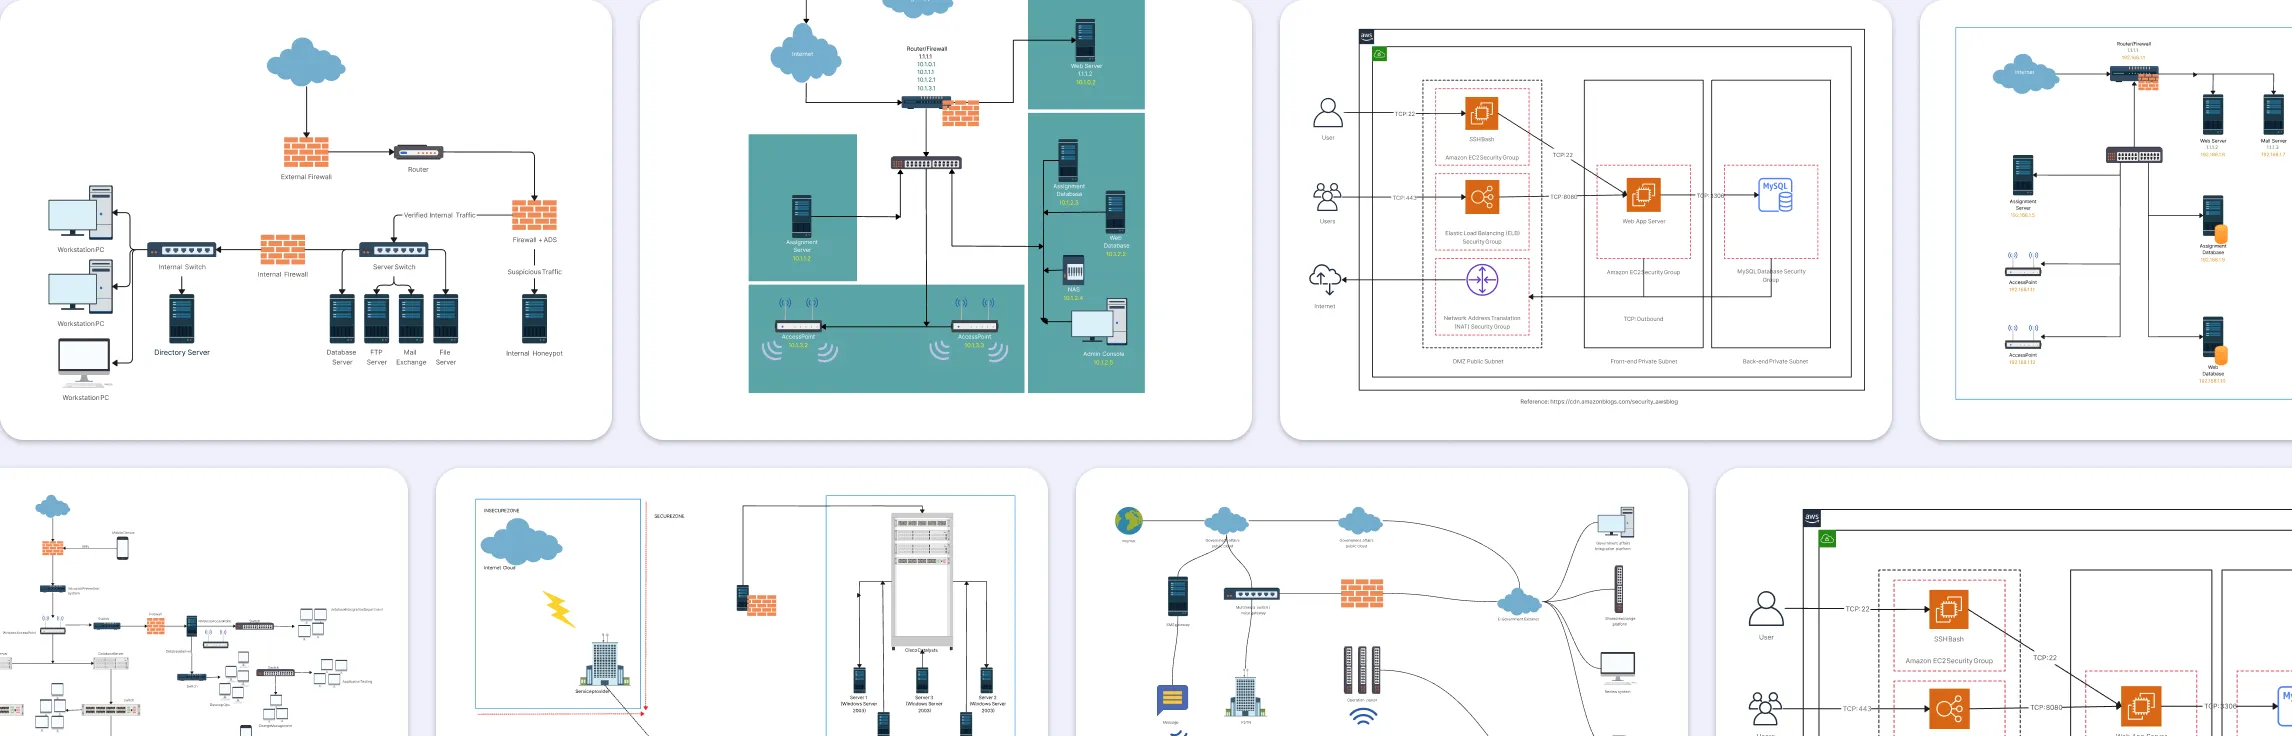
Free Network Diagram Templates
Now that you know how to create a network diagram, here are some templates to get you started.
Simple Network Diagram Example


Advance Home Network With Cisco

LAN HLD - Network Diagram

VLAN Network Diagram

Office Network Diagram Template