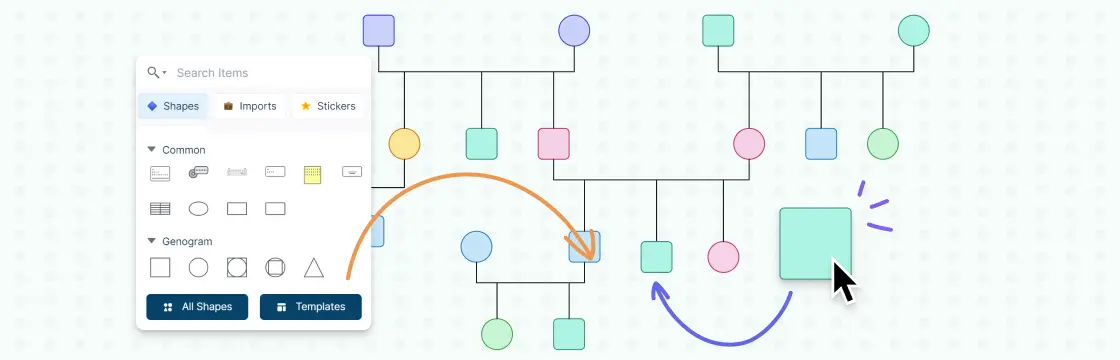
Learn how to make a genogram with ease using symbols, templates, and examples. This quick guide covers steps, tools, and best practices for building accurate family genograms.
What Is a Genogram
A genogram is a visual map of a family that shows relationships, patterns, and key details across generations. Unlike a basic family tree, it can also include things like marriages, health history, and emotional connections.
How to Make a Genogram in 7 Steps
Making a genogram is a relatively straightforward process. Here’s how to make a genogram step by step:
- Gather family history and key personal details
- Choose the right genogram symbols
- Build the family structure by generation
- Add important relationship and background details
- Label each family member clearly
- Show connections and relationship dynamics
- Review the genogram for patterns and insights
Step 1. Gather information
Start by collecting detailed information about each family member. This includes names, birthdates, and key life events, but aim to go further by exploring information that reveals patterns, such as:
- Education and career paths
- Health conditions or major illnesses
- Significant life events, challenges, or achievements
Speaking to multiple relatives can help you gather different perspectives and fill in any gaps, creating a fuller picture of your family’s history.
Step 2. Choose symbols
Genograms are most effective when genogram symbols are used consistently and with intent. Standard genogram symbols are designed to quickly represent complex family relationships and patterns, so it’s worth taking time to learn them. If your family has unique dynamics, such as recurring health issues or shared generational hobbies, you can also create custom symbols to reflect those.
Step 3. Draw the genogram
Begin with yourself at the center or base of the genogram, connecting yourself to your parents, siblings, and then extended family. Arrange each generation hierarchically, with older generations at the top and younger generations below. To maintain clarity:
- Work systematically from one side of the family to the other.
- Draw from oldest to youngest within each generation for an organized flow, making it easier to spot patterns.
Step 4. Include additional details
This step is where the genogram can go beyond a simple family tree and become a rich resource for understanding family dynamics. Use different lines or markers to indicate marriages, divorces, estranged relationships, adoptions, and other important connections. By differentiating between relationship types, you can highlight key dynamics and see patterns or recurring issues (like separations or tight family bonds) that have affected multiple generations.
Step 5. Add labels
Each family member should be labeled not just with their name but also with any relevant identifiers that make their role or history clear at a glance. Consider labeling with details that stand out or may have impacted family dynamics, such as educational achievements, major relocations, or significant life changes. Including full names and both birth and death dates (if applicable) helps anchor each individual’s place in the family history.
Step 6. Indicate connections
Represent relationships with a variety of line styles and thicknesses to convey the type and strength of each connection. Solid lines can represent strong or close connections, while dashed or thinner lines could indicate less frequent or strained interactions. If emotional or behavioral patterns are central to your genogram’s purpose, use distinct line styles to represent types of relationships (e.g., supportive, conflicted, distant), giving added depth to the visual.
Step 7. Interpret and analyze
This step involves closely studying the genogram to identify themes, behavioral patterns, and any recurring influences that emerge across generations. Look for intergenerational patterns, like career paths, family health trends, or recurring interpersonal dynamics (such as strong bonds between certain family members or frequent relocations). Taking time to analyze these patterns can help you understand how family histories shape current relationships and experiences.
Creately’s genogram maker simplifies this process by giving you:
- AI text-to-genogram to turn written family or case notes into a structured genogram
- 71 relationship types with clinical-style notation for more accurate family mapping
- Ready-made genogram templates to get started faster
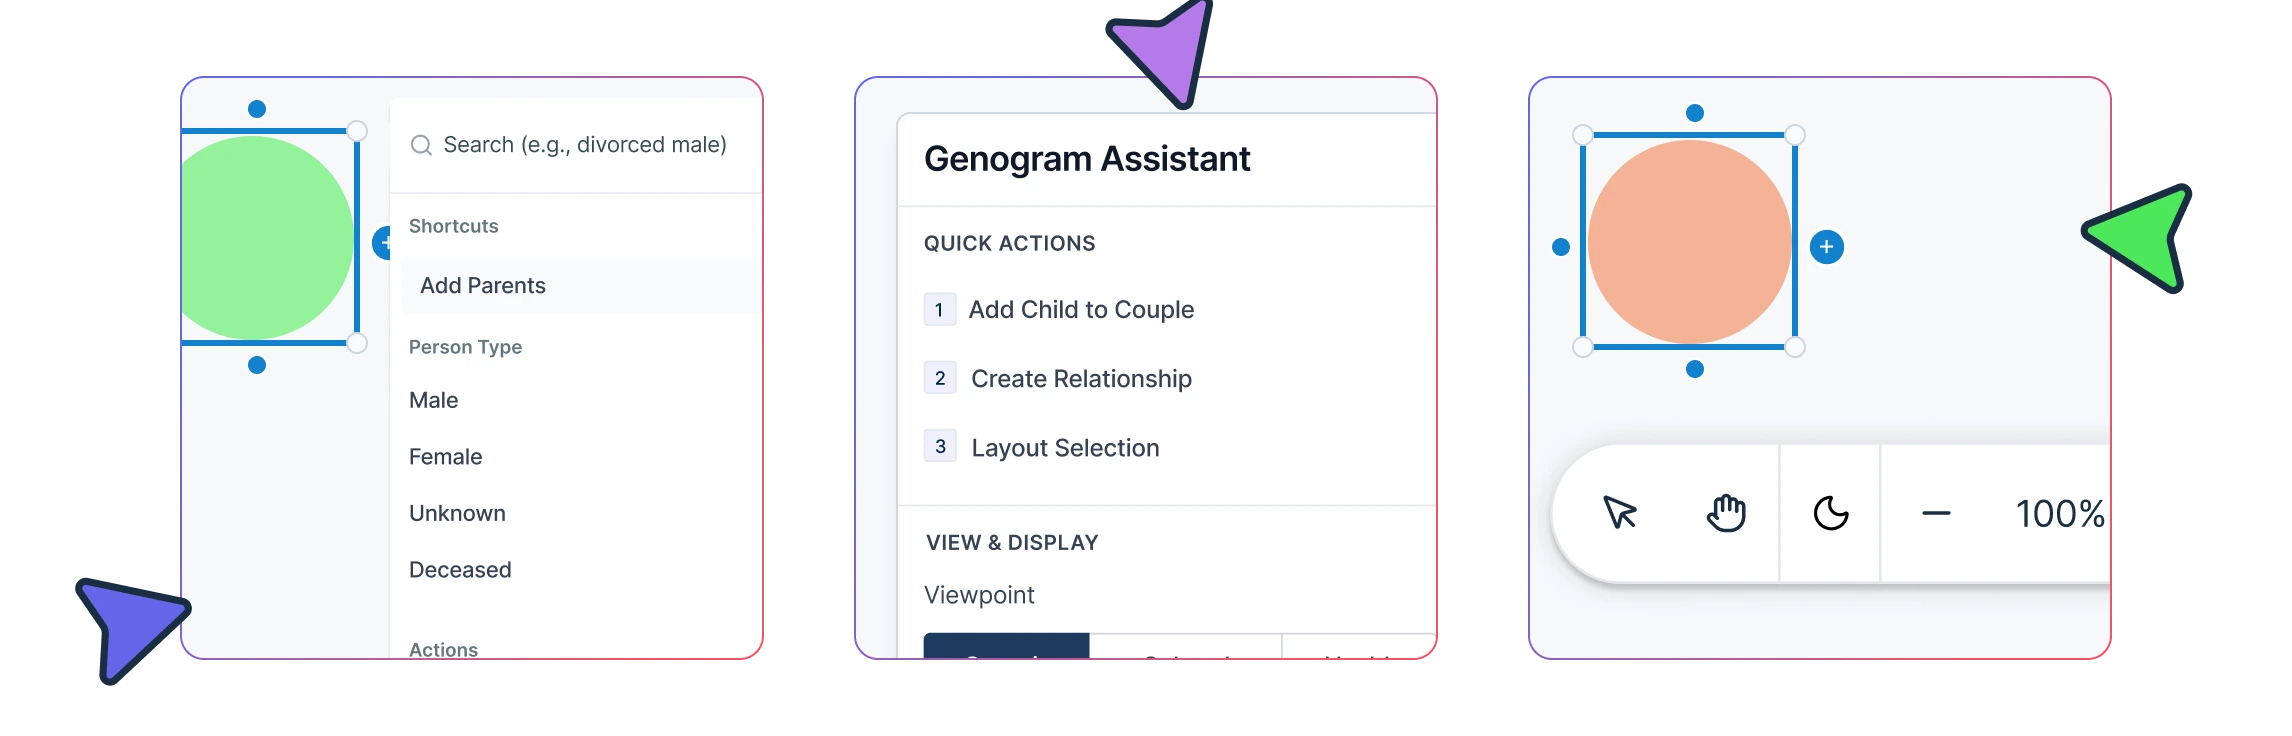
- Quick-add controls and auto-layout to build and expand multi-generational genograms easily
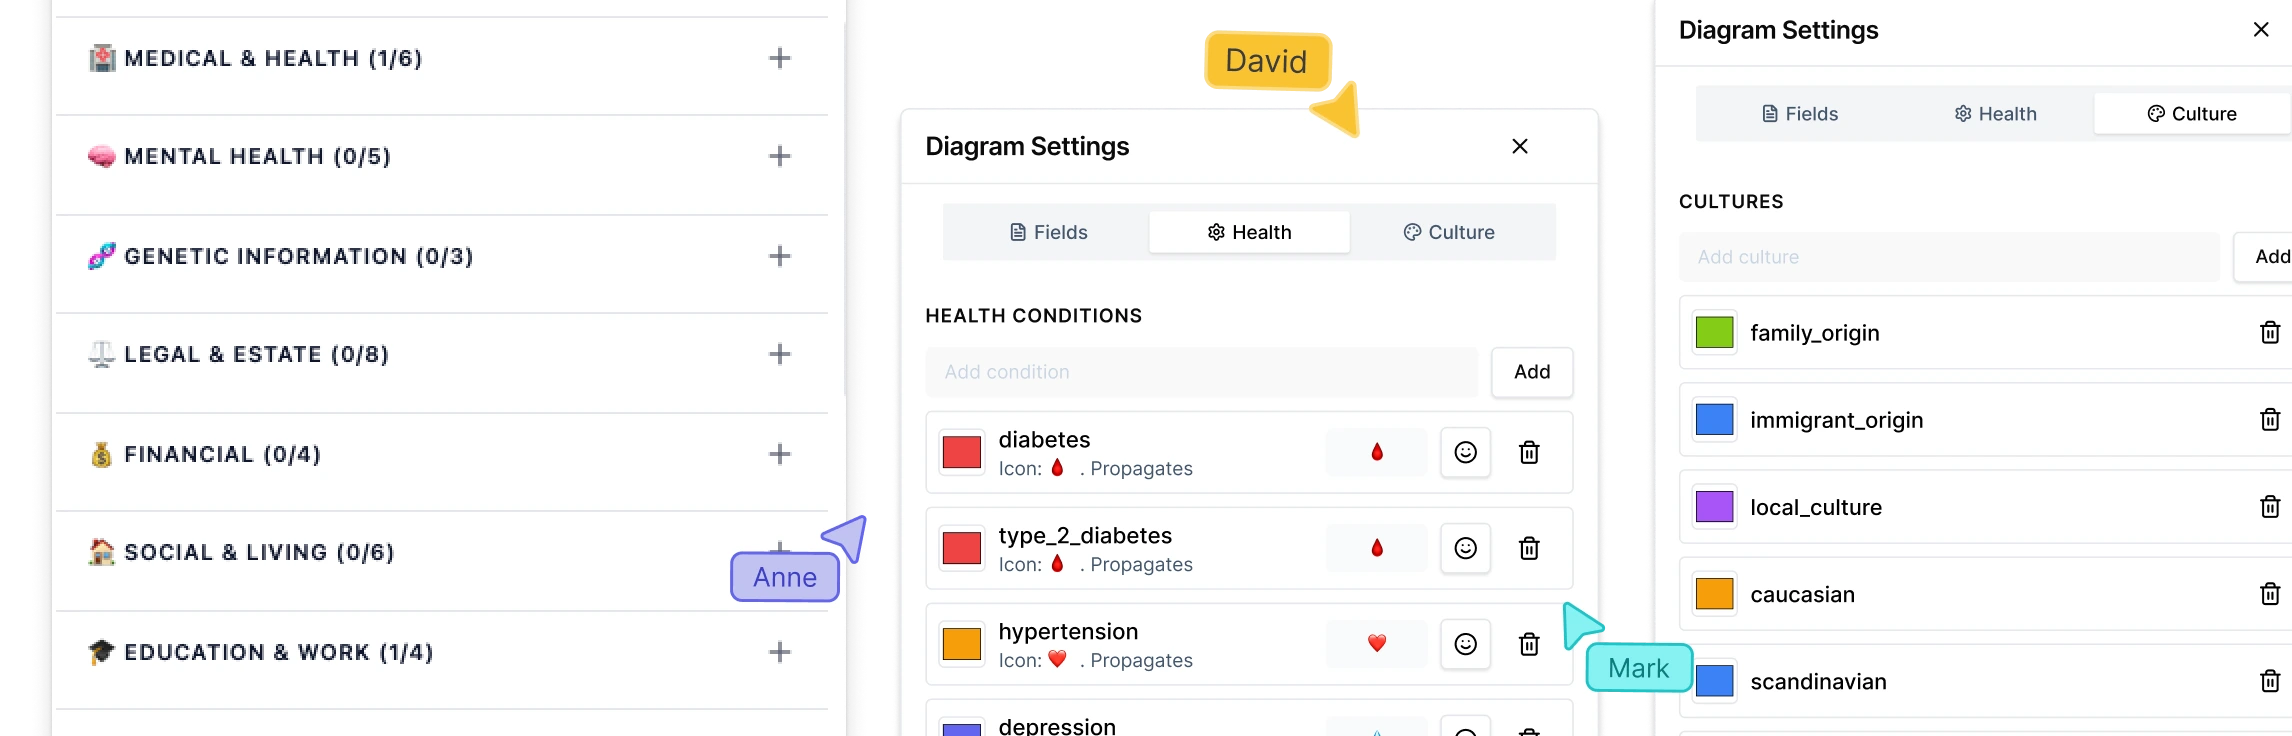
- Dynamic person shapes and field packs to capture medical, cultural, legal, or research details clearly
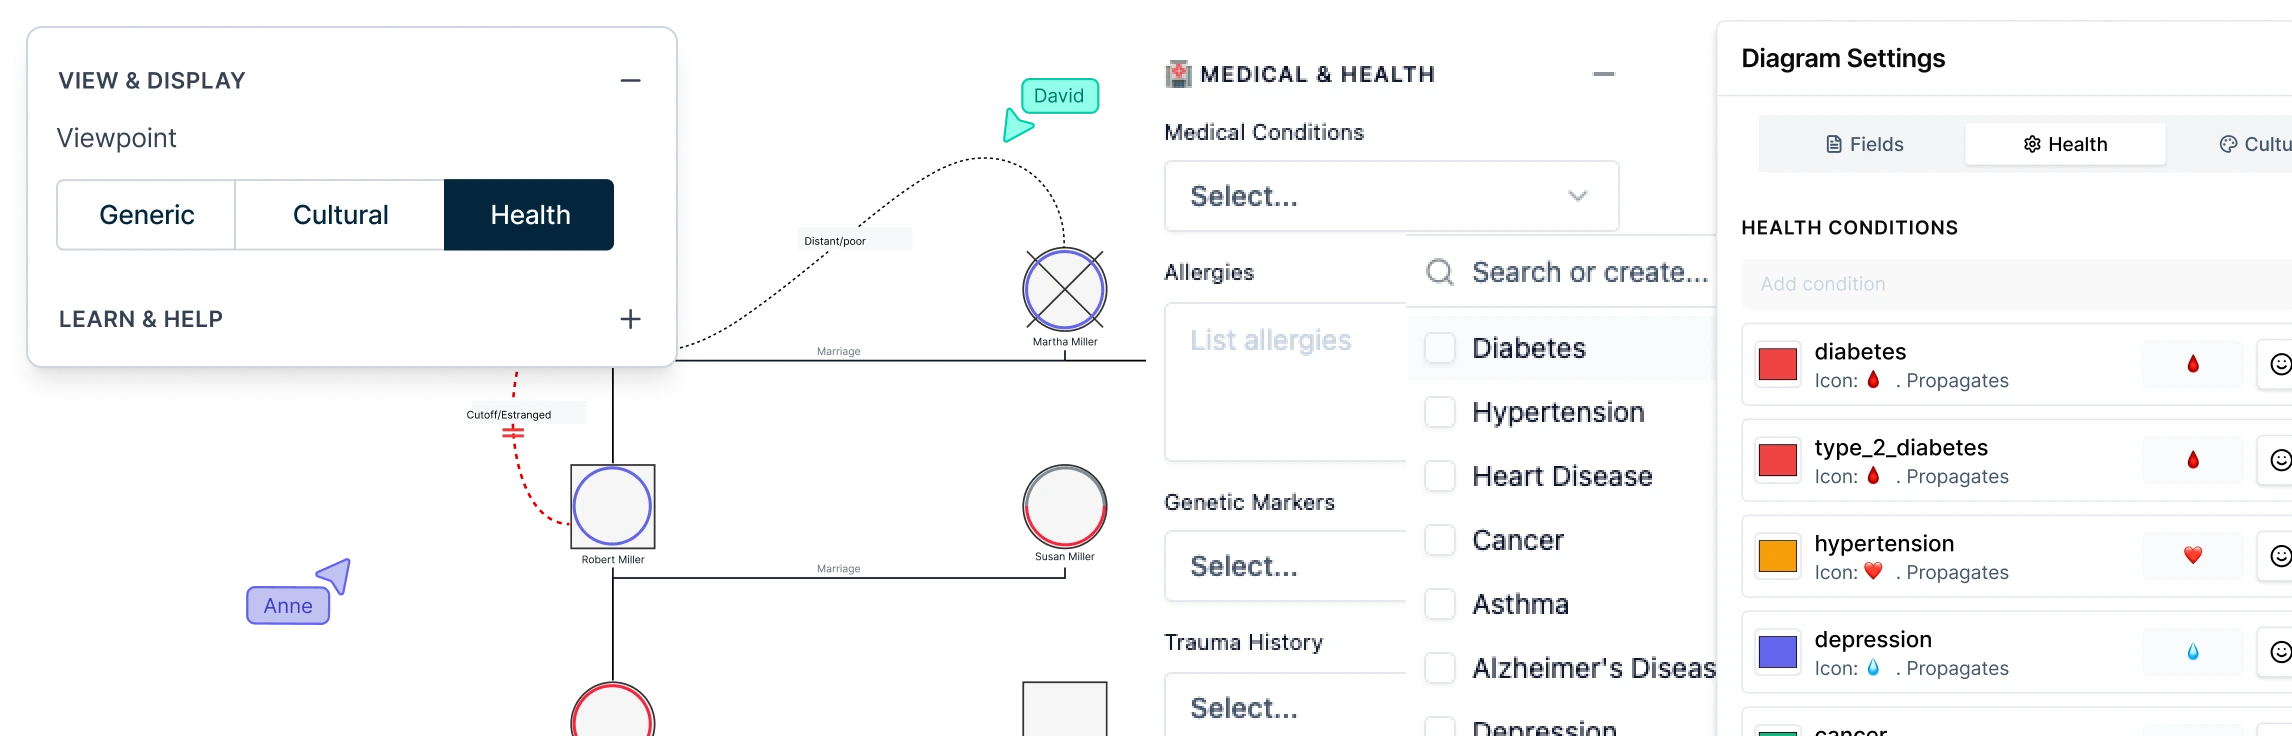
- Health and culture views to highlight patterns, conditions, and heritage across the family
- Easy export and sharing options for reports, collaboration, and documentation
Why Create a Genogram?
A genogram shows your family members and helps you understand important patterns like health issues, emotions, and relationships that affect your family.
Here are some key reasons to create a genogram:
1. To understand family patterns
Genograms help you see repeating behaviors, roles, or dynamics across generations—like cycles of conflict, divorce, or support. This insight is especially useful in therapy or personal reflection.
2. To explore emotional relationships
Unlike a regular family tree, genograms show emotional bonds between people. You can see who is close, distant, or in conflict—helping you understand your emotional environment better.
3. To track medical history
Genograms are often used in healthcare to map out genetic risks and recurring health conditions. They give doctors a clear picture of hereditary issues like heart disease, cancer, or mental health disorders.
4. To support therapy and counseling
Therapists use genograms to explore how a client’s family history affects their current relationships and challenges. It’s a helpful visual tool for starting meaningful conversations.
5. To guide decisions in social work
Social workers use genograms to assess family systems, identify risks, and create better support plans for individuals and families in need.
6. To reflect on your own story
You don’t have to be a professional to use a genogram. Many people create one simply to learn more about where they come from and how their upbringing may have shaped who they are today.
When to Create a Genogram
A genogram is more than a family tree. It’s a helpful visual tool that shows family patterns, relationships, and health history. Here’s when it can be most useful:
1. When you want a deeper understanding of family dynamics
Use a genogram when you want to explore emotional bonds, roles, and recurring behaviors in your family. It helps reveal how the past affects the present.
2. In therapy and counseling sessions
Therapists often use genograms to uncover hidden patterns, relationship issues, or emotional struggles passed down through generations.
3. When tracking medical history
They’re valuable for spotting inherited health conditions like heart disease, diabetes, or mental health concerns—useful for better prevention and care.
4. During major life transitions
Big family shifts like divorce, loss, or remarriage are easier to understand with a genogram. It shows new roles and helps people adjust.
5. For estate planning and legal purposes
In legal matters, a genogram helps organize family relationships clearly—useful in inheritance planning and avoiding confusion or disputes.
6. In social work and case management
Social workers use genograms to see family support systems and spot areas needing help. It gives a quick, clear view of relationships and risks.
7. In educational settings
Educators or school counselors can use genograms to understand a student’s home life and better support their learning and well-being.
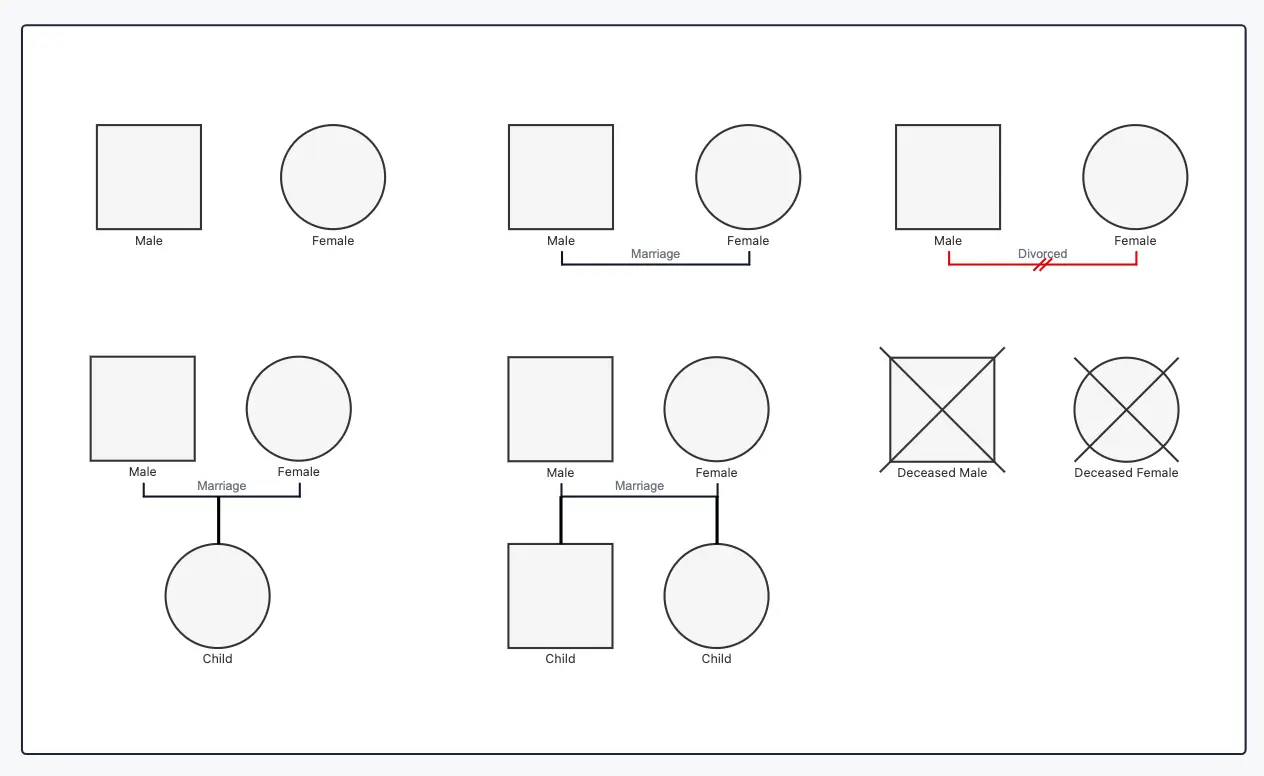
Common Genogram Symbols
Here are a few of the most common genogram symbols you’ll come across when creating or reading a genogram:
| Symbol | Description |
| Male | Represented by a square. Used to show male family members in the genogram. |
| Female | Represented by a circle. Used to show female family members in the genogram. |
| Marriage | A solid horizontal line connecting two individuals, indicating a married or long-term partner relationship. |
| Divorce | A horizontal line between partners marked with one or two slashes, showing separation or divorce. |
| Parent and child relationship | A vertical line drawn from the couple line down to a child, showing biological or adopted parent-child connections. |
| Sibling relationship | Children connected from the same horizontal line, indicating they share the same parents. |
| Deceased person | A square or circle with an X or slash through it, indicating the person has passed away. |
| Illness or medical condition | Shown using color, shading, or notes inside or next to the symbol to highlight specific health conditions or patterns. |
For a full list and visual examples, see our genogram symbols guide.
Genogram Tips, Best Practices, and Common Mistakes to Avoid
| Tips and best practices | Common mistakes to avoid |
| Start simple and build gradually—begin with immediate family, then expand across generations. | Trying to add too much detail at once, which can make the genogram cluttered and hard to read. |
| Use standard genogram symbols consistently to keep your diagram easy to understand. | Mixing symbols or using non-standard shapes that confuse the meaning. |
| Keep a clear structure—arrange family members by generation (top to bottom). | Placing people randomly without a clear hierarchy or generational flow. |
| Label clearly—add names, dates, and key details inside or near each symbol. | Leaving out important details or overcrowding symbols with too much text. |
| Use spacing and alignment to improve readability and avoid crossing lines. | Overlapping lines and shapes, making relationships difficult to follow. |
| Add a legend or key if you use colors, shading, or special markings. | Using colors or patterns without explaining what they represent. |
| Focus on your purpose—whether it’s medical, therapy, or family history. | Adding irrelevant information that doesn’t support your goal. |
| Review and update regularly as new information becomes available. | Treating the genogram as a one-time task and not keeping it updated. |
Genogram Examples and Templates
Now that you know how to make a genogram step by step, here are ready-to-use genogram templates you can use right away.
Family Genogram Template


Career Genogram

3 Generations Genogram Template

Cultural Genogram

Genogram Template for Relationship Types

Helpful Resources
Learn how genograms are used in psychology to understand family patterns, emotional dynamics, and behavioral influences.
Learn how to create a cultural genogram to map heritage, beliefs, traditions, and identity across generations.
Explore therapy genogram examples that show how family relationships and patterns can be visualized in practice.
Learn how to create a medical genogram to track family health history, inherited conditions, and risk patterns.
Learn how to create a therapy genogram to better understand family structure, emotional connections, and recurring issues.
See how to turn written family or case notes into a structured genogram faster with AI.
Learn how legal genograms help map family relationships, guardianship, inheritance, and other legal connections clearly.
Speed up genogram creation with keyboard shortcuts for quickly adding family members and building relationships.
Here’s a quick tutorial on how to draw a genogram using Creately.
References
Joseph, B., Dickenson, S., McCall, A. and Roga, E. (2022). Exploring the Therapeutic Effectiveness of Genograms in Family Therapy: A Literature Review. The Family Journal, 31(1), pp.21-30. doi:https://doi.org/10.1177/10664807221104133.
www.sciencedirect.com. (n.d.). Genogram - an overview | ScienceDirect Topics. [online] Available at: https://www.sciencedirect.com/topics/medicine-and-dentistry/genogram.