Neural networks power many of the intelligent systems we use every day, but what happens inside these models can feel abstract and hard to visualize. A neural network diagram brings clarity by turning complex learning processes into a simple, visual structure you can actually understand. In this guide, you’ll explore what neural networking diagrams are, how neural networks are used, their key components, common examples, and how to create one yourself.
What is a Neural Network Diagram?
A neural network diagram is a visual representation of an artificial neural network (ANN) that shows how data flows through layers of interconnected nodes (neurons) to produce an output. It helps explain how machine learning and deep learning models process inputs, learn patterns, and make predictions.
What are Neural Network Diagrams Used For?
Neural networking diagrams help engineers, data scientists, educators, and stakeholders design, explain, analyze, and document neural-network-based systems across a wide range of applications.
Explaining model architecture: Visualize input layers, hidden layers, output layers, neurons, and connections to clearly explain how a neural network processes data.
Image and video recognition systems: Illustrate convolutional layers, feature extraction stages, and classification outputs used in face recognition, object detection, medical imaging (X-rays, MRIs), and autonomous vehicles.
Natural language processing (NLP) models: Show how text flows through embedding layers, recurrent or transformer layers, and output layers in applications such as translation, chatbots, sentiment analysis, summarization, and speech-to-text systems.
Speech and audio processing pipelines: Represent neural architectures used in voice assistants, speech recognition, speaker identification, and noise reduction.
Predictive analytics and forecasting: Map how historical data is processed to predict outcomes such as sales, demand, stock prices, customer churn, or system failures.
Recommendation systems: Visualize user–item interactions, embedding layers, and scoring mechanisms behind personalized recommendations for e-commerce, streaming platforms, and social media.
Fraud detection and cybersecurity: Show how neural networks analyze transaction patterns or network traffic to detect anomalies, intrusions, or fraudulent behavior.
Healthcare and life sciences: Document neural models used for disease diagnosis, risk prediction, drug discovery, and personalized treatment planning.
Autonomous systems and robotics: Illustrate perception, decision-making, and control networks used in robots, drones, and self-driving vehicles.
Generative AI systems: Explain architectures behind models that generate text, images, audio, video, and code by learning complex data distributions.
Key Components in a Neural Network Diagram
Together, these components help neural networking diagrams clearly communicate how data moves through the model, how learning happens, and how predictions are generated, making complex models easier to understand and explain.
Input Layer: Represents the raw input features provided to the model, such as numerical values, text embeddings, or image pixels. Each node corresponds to one feature.
Neurons (Nodes): The basic processing units of the network. Each neuron receives inputs, applies weights, adds a bias, and passes the result through an activation function.
Weights: Connections between neurons that determine how strongly one neuron influences another. Learning a neural network primarily means adjusting these weights.
Bias: An additional parameter added to a neuron’s weighted input. Bias helps the model fit data more flexibly by shifting activation thresholds.
Hidden Layers: One or more layers between the input and output layers where feature transformation and pattern learning occur. Deep neural networks contain multiple hidden layers.
Activation Functions: Mathematical functions (such as ReLU, sigmoid, or softmax) that introduce non-linearity, allowing the network to model complex relationships.
Output Layer: Produces the final result of the network, such as a classification label, probability distribution, or numerical prediction.
Loss Function (often implied): Measures how far the model’s predictions are from the actual values. It guides the learning process during training.
Data Flow Direction: Arrows in the diagram indicate forward propagation (input to output) and, in training diagrams, backward propagation for weight updates.
Neural Network Diagram Examples
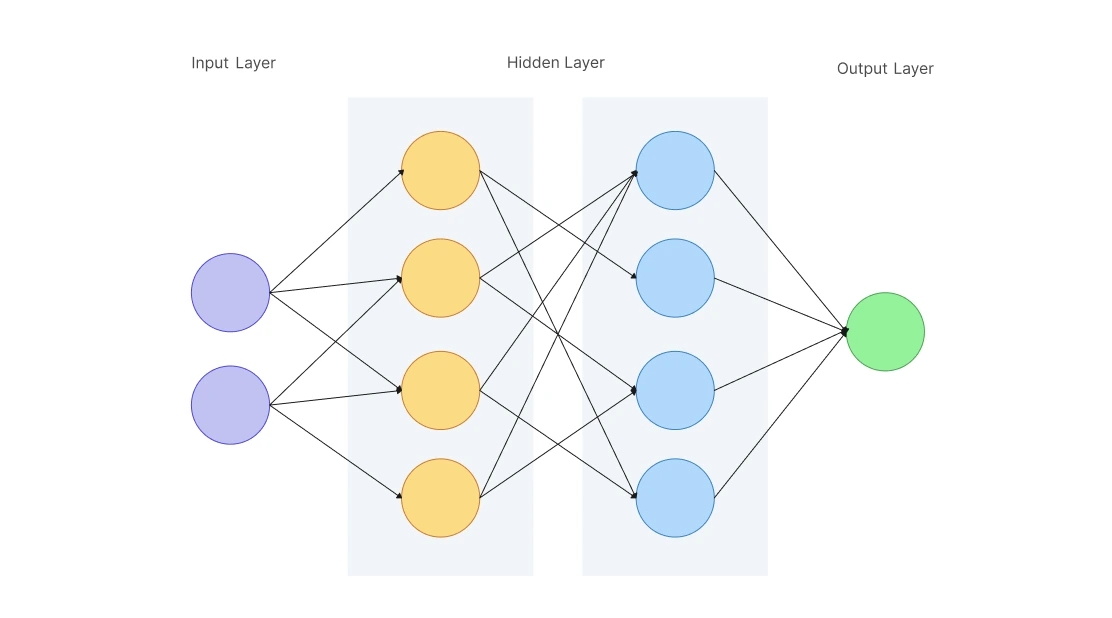
Simple Neural Network Diagram
This basic diagram of a neural network with an input layer, one hidden layer, and an output layer. It is mainly used for teaching fundamentals such as neurons, weights, biases, and activation functions. Suitable for simple regression or binary classification problems.


Multilayer Perceptron Diagram (MLP)
A Multilayer Perceptron diagram represents a fully connected, feed forward neural network with multiple hidden layers. Every neuron in one layer connects to every neuron in the next. MLPs are widely used for structured data tasks like prediction, classification, and pattern recognition.

Convolutional Neural Network Diagram (CNN)
This diagram highlights convolution layers, pooling layers, and fully connected layers. CNNs are designed to automatically learn spatial features from images or videos and are commonly used in image recognition, object detection, and medical imaging.

Recurrent Neural Network Diagram (RNN)
An RNN diagram includes feedback loops that allow information to persist across time steps. This architecture is suited for sequential or time-dependent data such as speech, text, sensor data, and time-series forecasting.

Deep Neural Network Diagram (DNN)
A Deep Neural Network diagram shows many stacked hidden layers, enabling the model to learn complex and hierarchical features. DNNs are the foundation of modern deep learning systems used in recommendation engines, predictive analytics, and generative AI.

How to Draw a Neural Network Diagram
Follow these steps using Creately’s network diagram software to create a clear and easy-to-understand neural networking diagram, whether for learning, design, or documentation.
Step 1: Define the purpose of the network
Decide what the neural network is meant to do, such as classification, prediction, image recognition, or sequence processing. This determines the type of network you will draw (MLP, CNN, RNN, etc.).
Step 2: Draw the input layer
Start with the input layer on the left. Each node represents an input feature, such as numerical values, pixels, or word embeddings. Label the inputs clearly.
Step 3: Add hidden layers
Draw one or more hidden layers between the input and output layers. Each layer should contain multiple neurons, connected to the previous layer. The number of hidden layers reflects the model’s depth.
Step 4: Connect neurons with weighted links
Draw arrows between neurons in adjacent layers to represent weighted connections. In fully connected networks, every neuron connects to all neurons in the next layer.
Step 5: Indicate activation functions
Optionally label activation functions (e.g., ReLU, sigmoid, softmax) at each layer or near representative neurons to show how non-linearity is introduced.
Step 6: Draw the output layer
Add the output layer on the right. The number of output neurons depends on the task—one for regression, multiple for classification, or probabilities for multi-class outputs.
Step 7: Label, organize, and review
Use clear labels, consistent spacing, and directional arrows to show data flow from input to output. Review the diagram to ensure it accurately represents the intended neural network model.
FAQs about Neural Network Diagrams
How many hidden layers should be shown in a neural network diagram?
What symbols are typically used in neural network diagrams?
Do neural networking diagrams show training processes?
What is the difference between a logical and a detailed neural network diagram?
Resources
Guo, Tianmei, et al. “Simple Convolutional Neural Network on Image Classification.” 2017 IEEE 2nd International Conference on Big Data Analysis (ICBDA), Mar. 2017, https://doi.org/10.1109/icbda.2017.8078730.
Kruse, Rudolf, et al. “Multi-Layer Perceptrons.” Texts in Computer Science, 1 Jan. 2022, pp. 53–124, https://doi.org/10.1007/978-3-030-42227-1_5.