Managing a network without a clear map can feel like navigating a maze blindfolded. Cables tangled, devices misplaced, and troubleshooting taking hours instead of minutes. That’s where a physical network diagram comes in. This guide will show you exactly what a physical network diagram is, why it matters, and how to create one step by step. You’ll also learn about its key components, common topologies, best practices, and ready-to-use templates that make diagramming fast, accurate, and visually intuitive.
What Is a Physical Network Diagram?
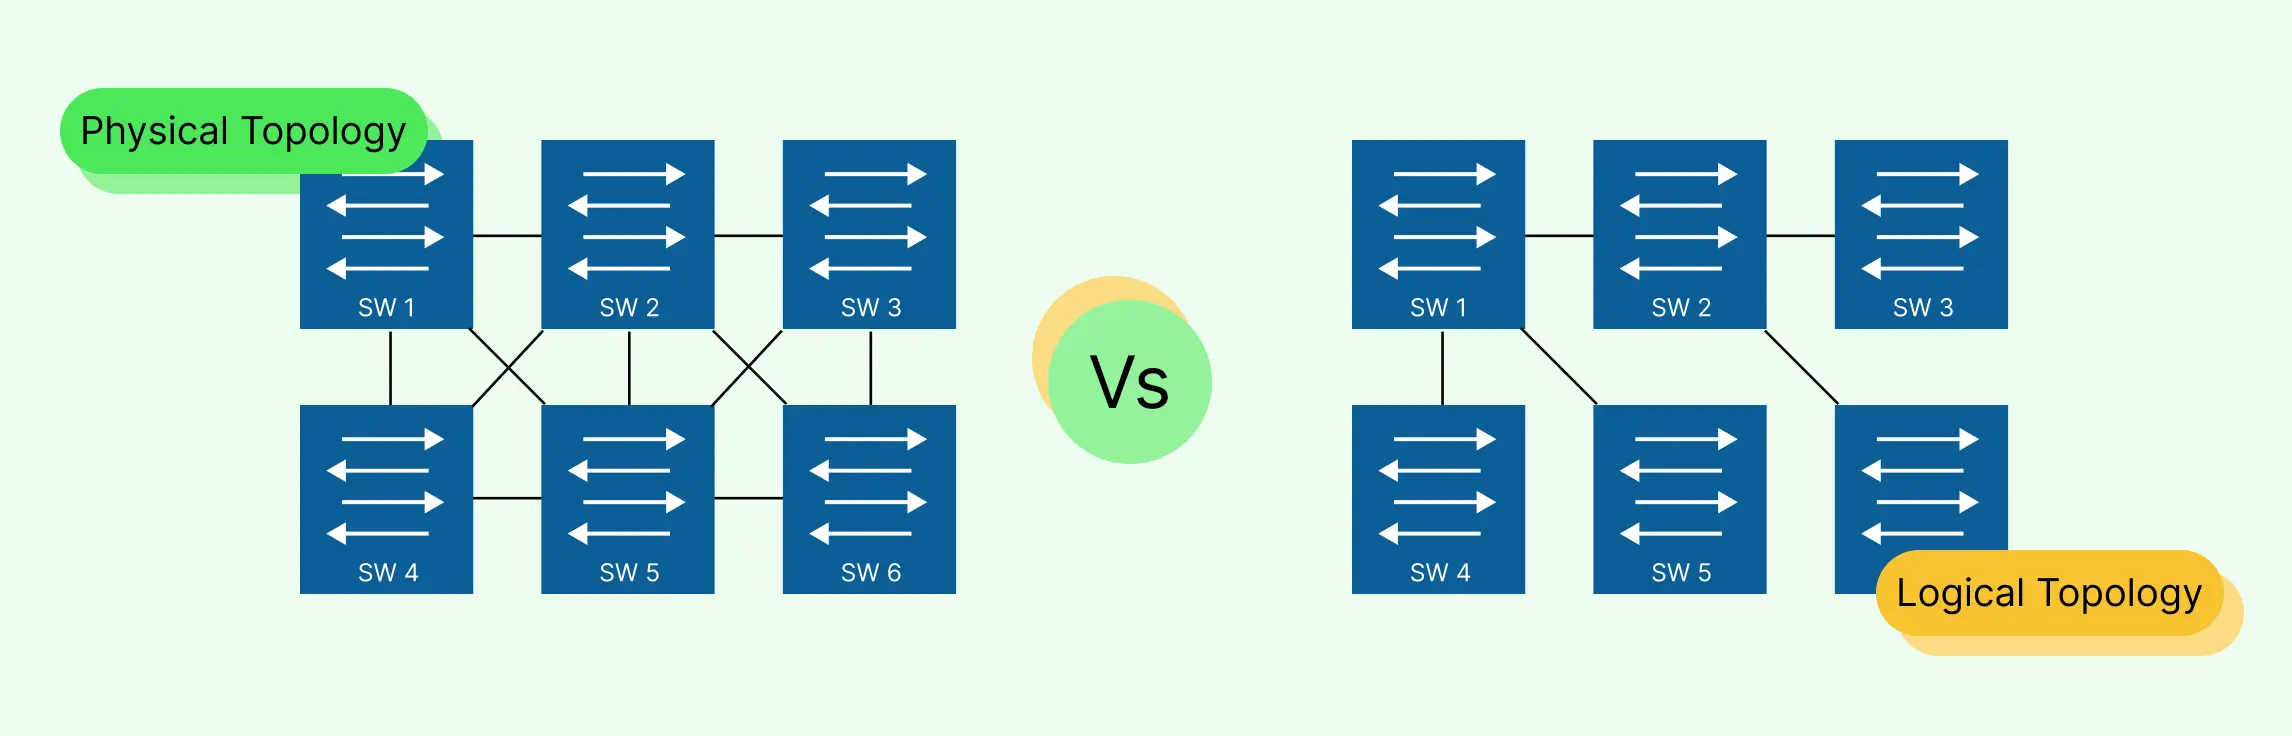
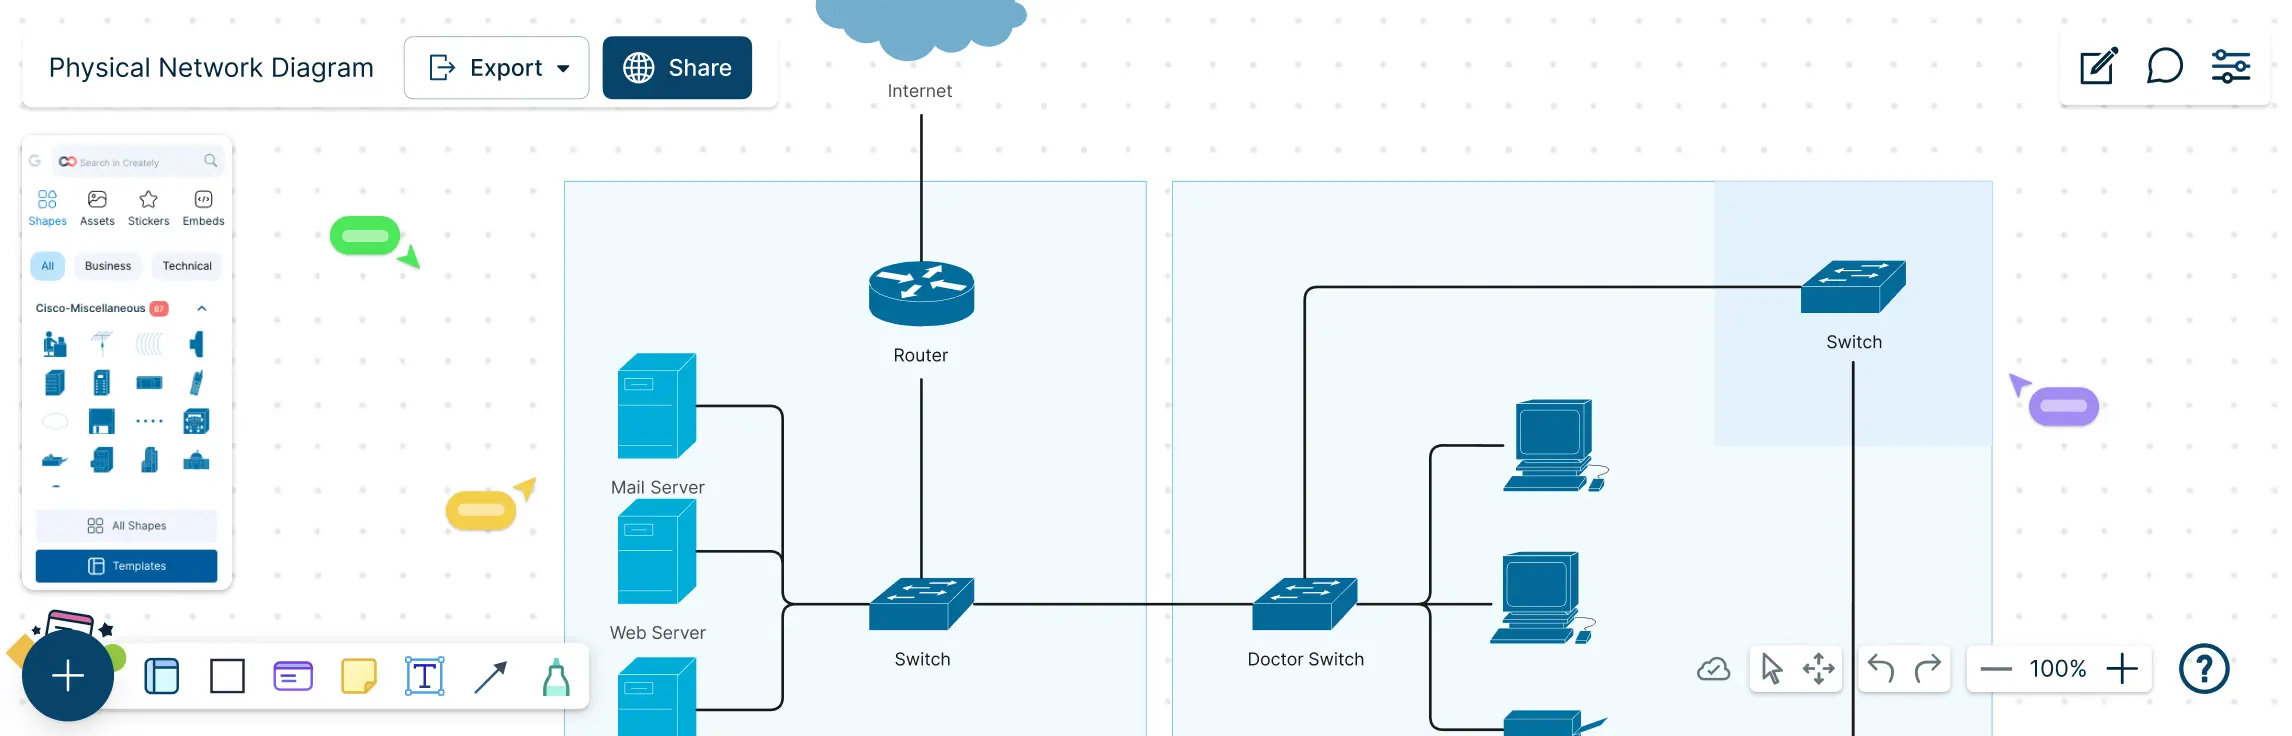
A physical network diagram is a visual map that shows the real-world layout of your network, including the devices, connections, and locations that make your IT infrastructure function effectively. Unlike abstract or logical diagrams, a physical network diagram focuses on what exists physically, not just how data flows. Think of it as a blueprint for your network’s tangible setup.


Components of a Physical Network Diagram
A physical network diagram isn’t just a bunch of boxes and lines. It’s a structured, visual representation of your network’s real-world components. Understanding the key elements helps you create diagrams that are clear, actionable, and truly useful for IT teams.
1. Floor Plan
A floor plan view shows where devices are located across a building or office space. This includes:
- Placement of routers, switches, and servers
- Workstations and access points
- Physical pathways for cabling
By visualizing devices in their real-world locations, a floor plan makes it easier to plan expansions, troubleshoot issues, and optimize device placement.
2. Rack Diagram
A rack diagram provides a detailed view of devices within server racks. This typically shows:
- Equipment mounted on each rack unit (U)
- Switches, routers, patch panels, and servers
- Power connections and airflow considerations
Rack diagrams help IT teams quickly locate hardware, plan upgrades, and maintain proper organization in data centers or server rooms.
3. IDF/MDF Documentation
Intermediate Distribution Frames (IDF) and Main Distribution Frames (MDF) are central points where network connections converge. Documenting these in your diagram ensures:
- Clear mapping of network distribution
- Easy identification of connection points for troubleshooting
- Accurate representation of backbone and horizontal cabling
Proper IDF/MDF documentation prevents confusion over which connections serve which areas of the network.
4. Cabling Map
A cabling map shows all physical connections between devices, including:
- Ethernet and fiber cabling routes
- Patch panels and port numbers
- Connections between IDFs, MDFs, and end devices
Cabling maps make maintenance easier, reduce downtime during changes, and ensure your network’s physical layer is always accurate and up to date.
Types of Physical Topology Network Diagrams
A physical topology network diagram shows how devices are physically connected in your network. While each topology has its own guide, here’s a concise overview to give context and help you choose the right layout:
- Bus Topology – All devices share a single backbone cable. Simple and cost-effective for small networks, but can be prone to collisions.
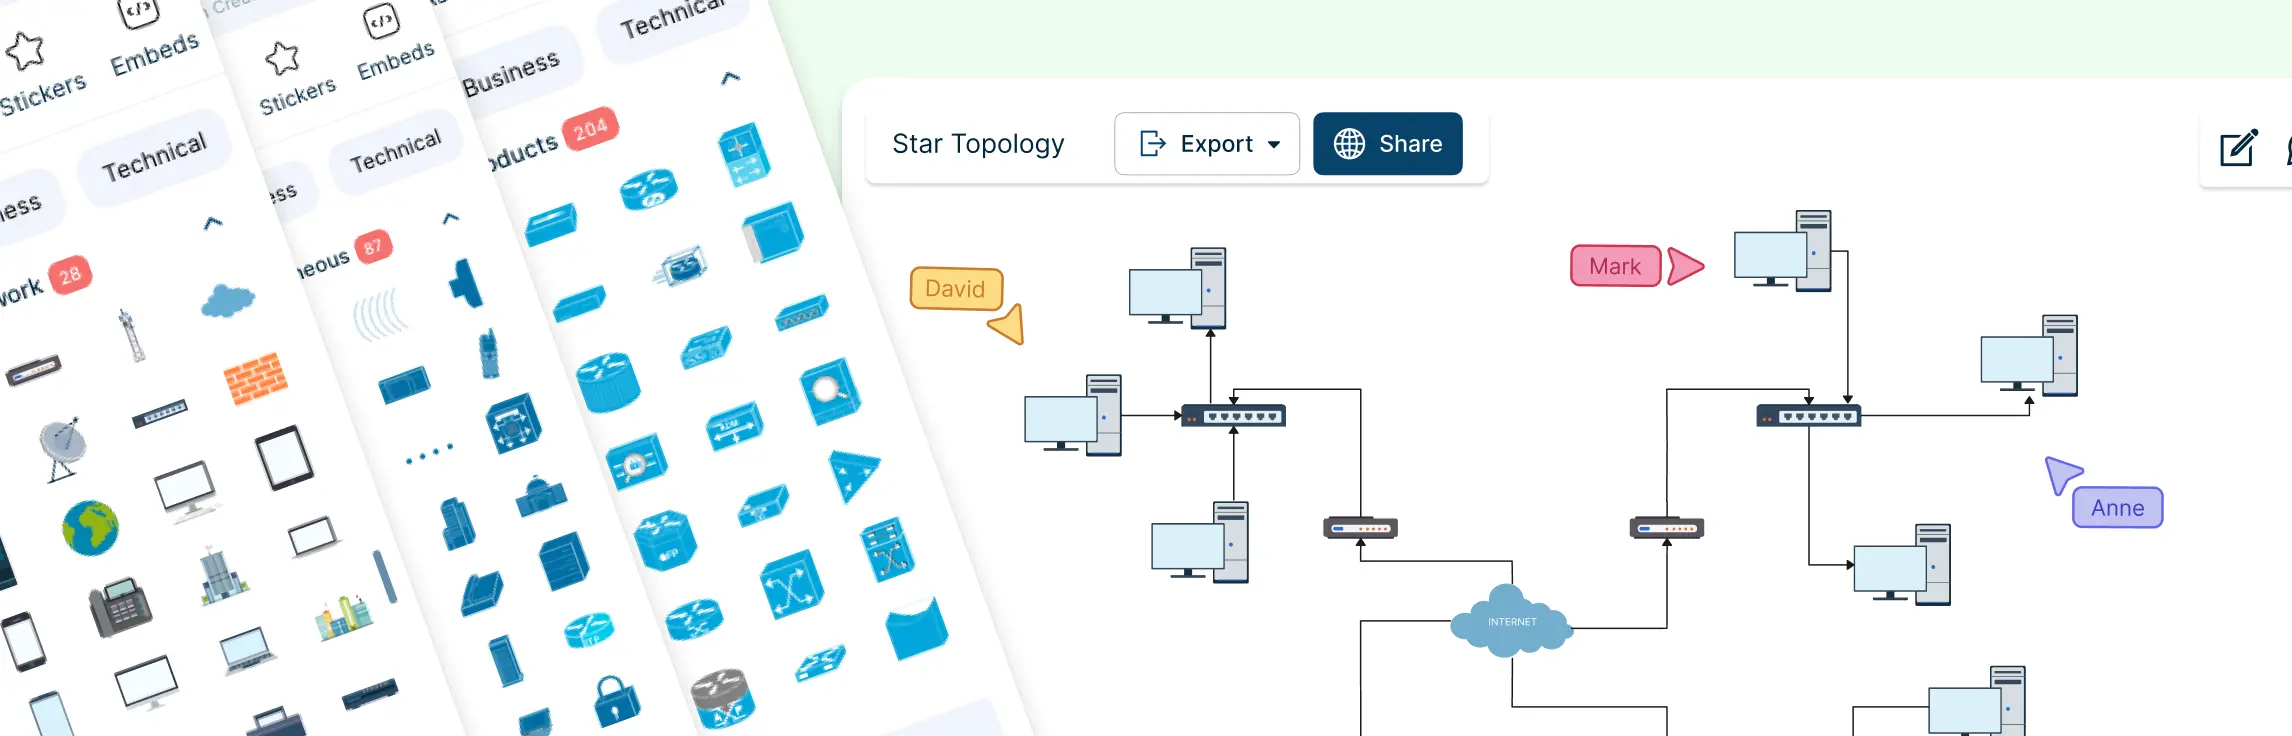
- Star Topology – Devices connect to a central hub or switch. Easy to manage and troubleshoot, making it popular for modern office networks.
- Ring Topology – Devices form a closed loop. Data travels in one direction, providing predictable paths but can be disrupted if one device fails.
- Mesh Topology – Every device is connected to multiple others. Highly redundant and reliable, ideal for mission-critical systems.
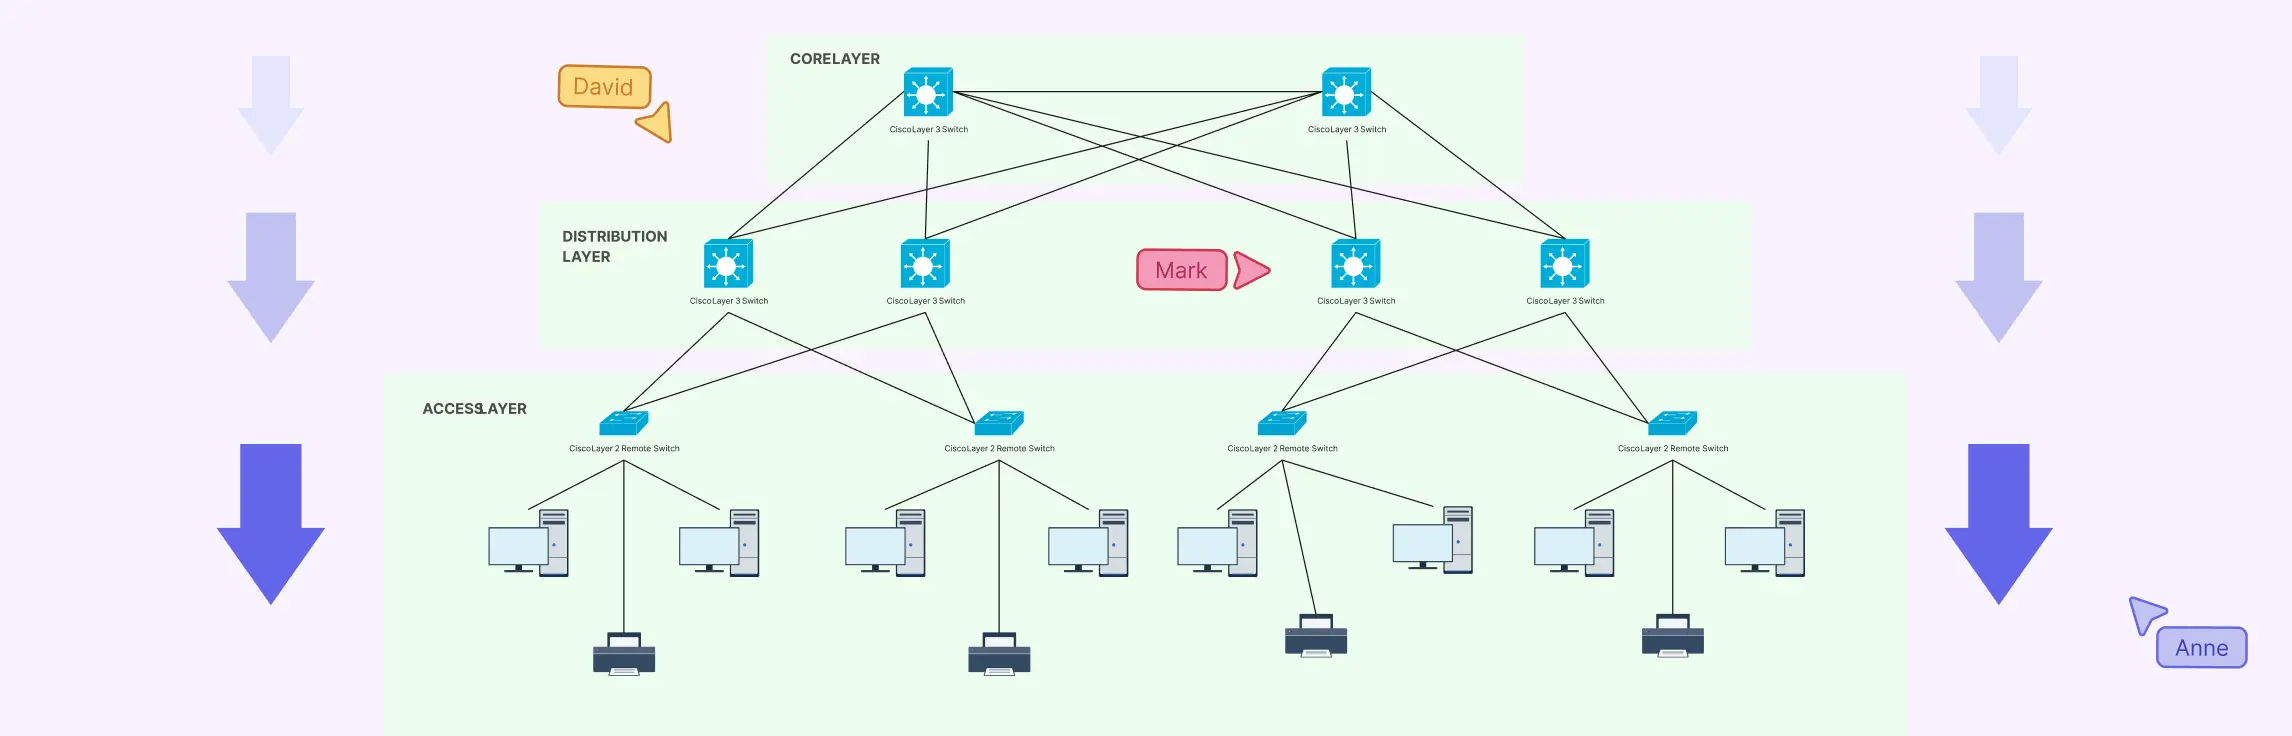
- Hybrid Topology – A mix of multiple topologies to leverage the strengths of each. Flexible and scalable for growing networks.
Each of these layouts can be visualized quickly in a physical network diagram, giving IT teams clarity at a glance. Linking to detailed guides ensures your readers get the full story without cluttering your main guide.
How to Make a Physical Network Diagram
Creating a physical network diagram doesn’t have to be complicated. By following a clear, step-by-step approach, you can transform a tangled network setup into a visual guide that’s easy to understand, share, and maintain.
Step 1: Identify All Physical Network Components
Start by taking inventory of everything in your network:
- Devices – Routers, switches, servers, firewalls, access points, and endpoints
- Cables – Ethernet, fiber optic, and patch cords
- Ports and interfaces – Switch ports, patch panels, and router interfaces
- Racks and locations – Server racks, IDFs/MDFs, rooms, or floors
Knowing exactly what exists is the foundation for a diagram that’s accurate and actionable. Creately has a comprehensive symbol library for all device types, including racks, servers, switches, etc.
Step 2: Decide Your Diagram Scope and Granularity
Before drawing, decide what you want to show and at what level of detail:
- Are you mapping a single floor or the entire campus?
- Do you want rack-level detail, including PDU outlets and port mappings, or just high-level connections?
- Customize Cretely templates to your network’s size, reducing setup time and keeping layouts consistent. Starting with the right template ensures clarity and keeps your diagrams professional from the first step.
Step 3: Map Physical Topology
Now start drawing the actual network:
- Place devices: Drag and drop switches, routers, servers, and other devices onto your floor plan or rack diagram.
- Label every device: Include hostnames, asset tags, and rack positions.
- Connect devices physically: Use lines for Ethernet, fiber, or power connections.
- Indicate paths and redundancy: Show uplinks, backup connections, and cable routes.
- Color-code cables for clarity (example: blue = Ethernet, orange = fiber uplink, red = power-critical, green = management)
Step 4: Document Cabling and Rack Details
A physical network diagram isn’t complete without a clear cabling and rack map.
Cabling best practices:
- Label both ends of every cable with matching IDs
- Include connector types and lengths for fiber runs (helps with attenuation and procurement)
- Color-code by function or criticality
Rack diagram checklist:
| Field | Why It Matters |
| Asset tag & hostname | Cross-reference with CMDB and monitoring systems |
| Device model & serial | Spare parts and warranty lookups |
| U position | Physical installation and cooling calculations |
| PDU outlet & breaker | Power budgeting and failover planning |
| Patch-panel/port mapping | Rapid cable tracing during incidents |
Step 5: Collaborate and Validate
Once your first draft is ready, collaboration is key:
- Conduct walk-throughs with IT, facilities, and cabling teams
- Cross-check port mappings, device labels, and cable routes against real hardware
- Update any discrepancies immediately
How Creately helps:
- Real-time collaboration: multiple team members can edit simultaneously
- Comments and annotations: leave notes directly on devices or connections
- Version history: track changes and revert if needed
Step 6: Publish and Maintain Your Diagram
Your diagram is most valuable when it’s accessible, versioned, and updated.
- Store diagrams in a shared location. Creately has cloud storage accessible from anywhere & secure sharing.
- Link diagrams to change tickets, CMDB entries, and runbooks
- Export printable rack sheets for technicians or embed in incident response documentation. Creately has many export options, including PNG, PDF, SVG, or embedding directly into documentation.
Step 7: Keep It Updated
Finally, a physical network diagram is never “done”. Networks change constantly, so maintain it by:
- Updating diagrams after moves, adds, or changes
- Conducting quarterly audits for large networks
- Linking diagrams with automated asset management systems
When maintained properly, your physical network diagram becomes the single source of truth, saving hours during troubleshooting, planning, or audits.
Physical Network Diagram Templates


Best Practices for Creating Clear Physical Network Diagrams
A well-designed physical network diagram isn’t just about accuracy. It’s about clarity and usability. Follow these best practices to make diagrams that your team can actually use:
Keep layouts clean and readable
- Avoid crisscrossing cables or crowded racks
- Space out devices evenly to make the diagram easy on the eyes
- Use grid alignment and structured layouts for instant comprehension
Label devices and ports consistently
- Include hostnames, asset tags, rack positions, and port IDs
- Maintain a standard naming convention to avoid confusion
- Ensure both ends of the cables are labeled with matching identifiers
Use color and grouping intentionally
- Color-code cables by type or function (Ethernet, fiber, power-critical, management)
- Group devices by rack, room, or floor for quick visual understanding
- Use shading or borders to highlight critical systems or redundant paths
Update diagrams as infrastructure changes
- Treat your diagram as a living document
- Update after moves, adds, or upgrades to maintain reliability
- Link diagrams to CMDBs or change tickets for quick reference
Avoid overloading a single diagram
- Break large networks into multiple diagrams: per floor, per building, or per rack
- Use summarized views for high-level planning, and detailed views for troubleshooting
- Creately’s infinite canvas makes it easy to manage large networks without clutter
A physical network diagram is more than just a drawing. It’s a visual blueprint that turns complex networks into clear, actionable maps. From understanding the key components and topologies to following step-by-step instructions for creating accurate diagrams, you now have everything you need to document, troubleshoot, and plan your network with confidence.
By using templates, consistent labeling, and collaboration features, you can save time, reduce errors, and ensure your team is always on the same page. Ready to bring clarity to your network? Try Creately today to start building professional, accurate, and visually stunning physical network diagrams in minutes.
Helpful Resources
Learn how to draw a network diagram step by step, from planning what to include to laying out components clearly and choosing the right symbols.
Discover key bus topology diagram elements, highlight common design patterns, and point out the limitations you need to account for when working with this topology.
Understand how to approach Cisco network topology diagrams with confidence and create visuals that are practical, accurate, and easy to understand.
Learn how to create a home network setup diagram step by step, understand common layouts, follow practical best practices, and use free templates to map your setup.
Discover how to create a wide area network diagram step by step, understand key components, WAN examples, and follow proven best practices.
Everything you need to know about LANs, from the basics and key components to network types, advantages, and best practices.
Discover what a logical network diagram is, how it differs from a physical network diagram, why it’s useful, and how to create one.