This guide walks you through the steps for how to create a process map in Excel, highlights the challenges you may encounter on the platform, and introduces a more efficient alternative for teams that need faster, clearer, and more scalable process mapping.
What is a Process Map?
A process map is a visual diagram that outlines the steps, decisions, and flow of a workflow or business process. It uses shapes, connectors, and labels to show how tasks move from one stage to the next, how information flows, and where responsibilities sit. Process maps make it easier to understand how a process works, identify bottlenecks, and spot opportunities for improvement. They can be used for simple or complex workflows, but creating a clear, well-structured map often requires careful layout and formatting to keep everything organized.
Read the process mapping guide to learn about different ways of process mapping, their symbols, and who uses them.
How to Make a Process Map in Excel
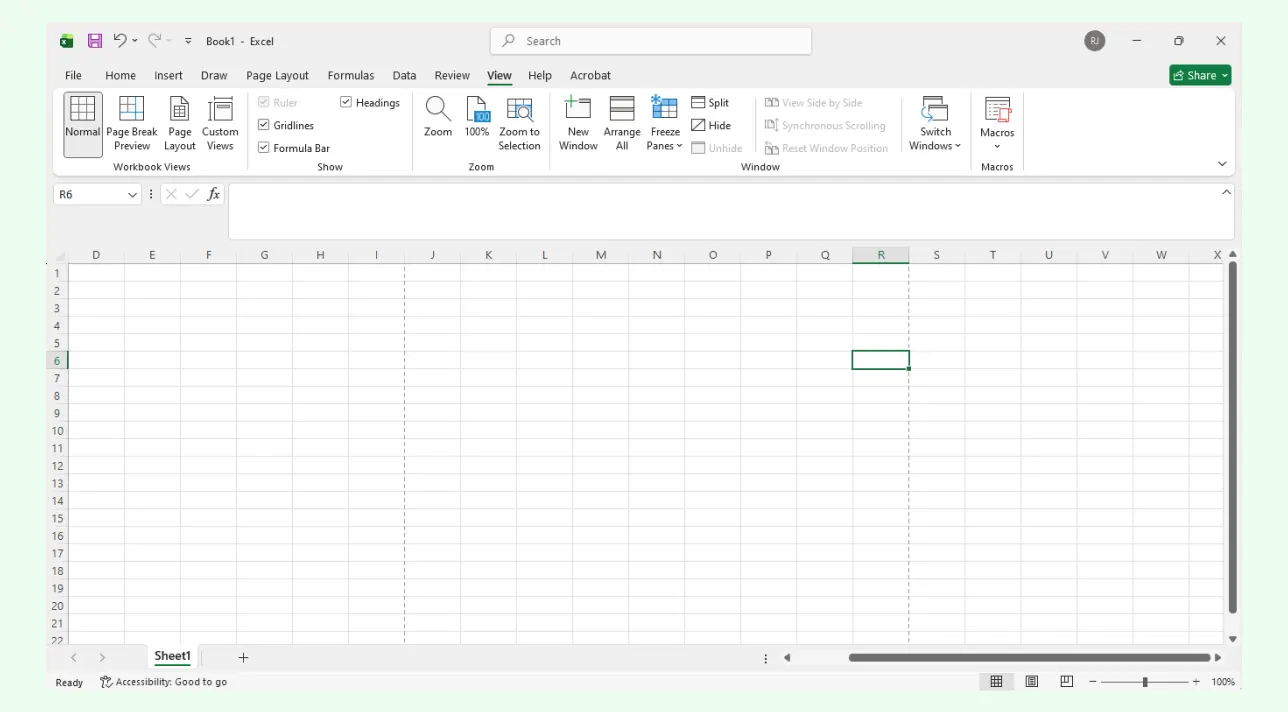
Step 1: Open a Blank Worksheet
Start with a clean worksheet and define the process scope, start and end points, audience, and level of detail. List the activities, decisions, roles, and handoffs before drawing so the map reflects a specific workflow rather than becoming an unstructured collection of shapes.
Step 2: Insert Process Map Shapes
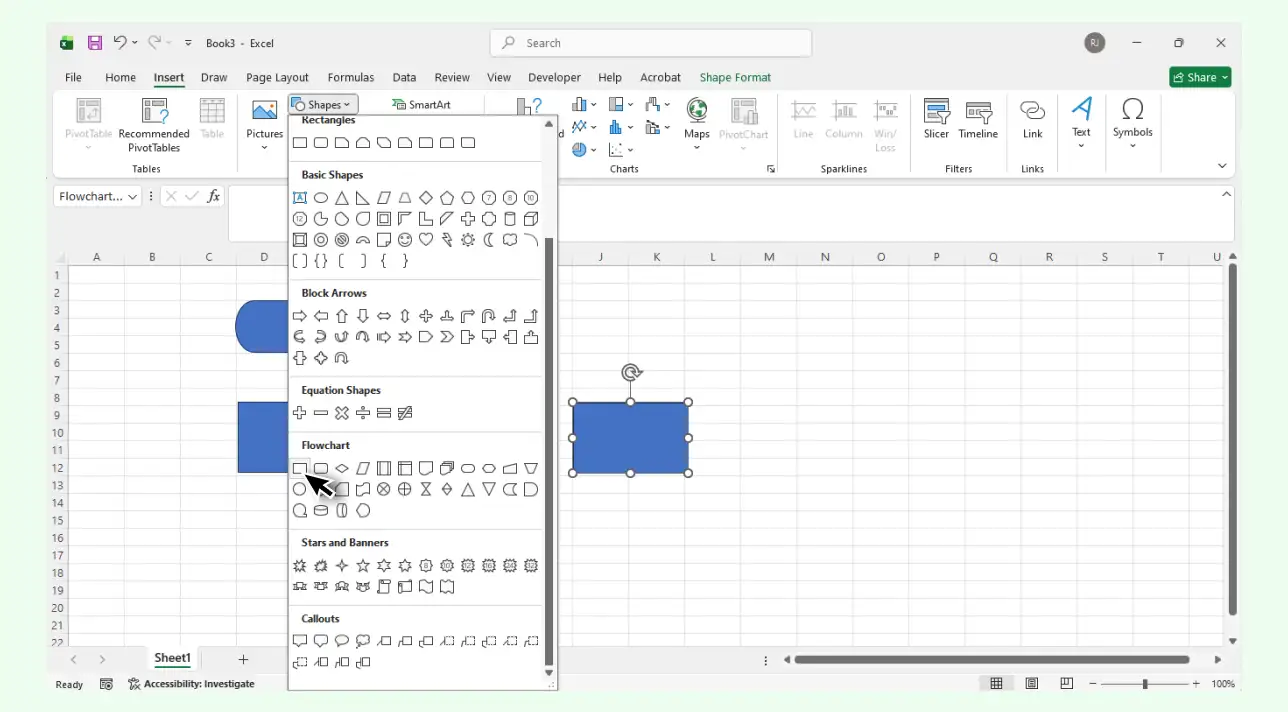
Go to Insert → Illustrations → Shapes and choose symbols from the Flowchart category, such as Process, Decision, and Terminator. Drag each shape onto the worksheet. For a simple sequential overview, you can instead use Insert → SmartArt → Process and select a suitable Process layout. Shapes provide more control for detailed branching, while SmartArt automatically arranges simpler sequences. Read the process mapping symbols guide to learn what common symbols represent.
Step 3: Add and Label Each Step
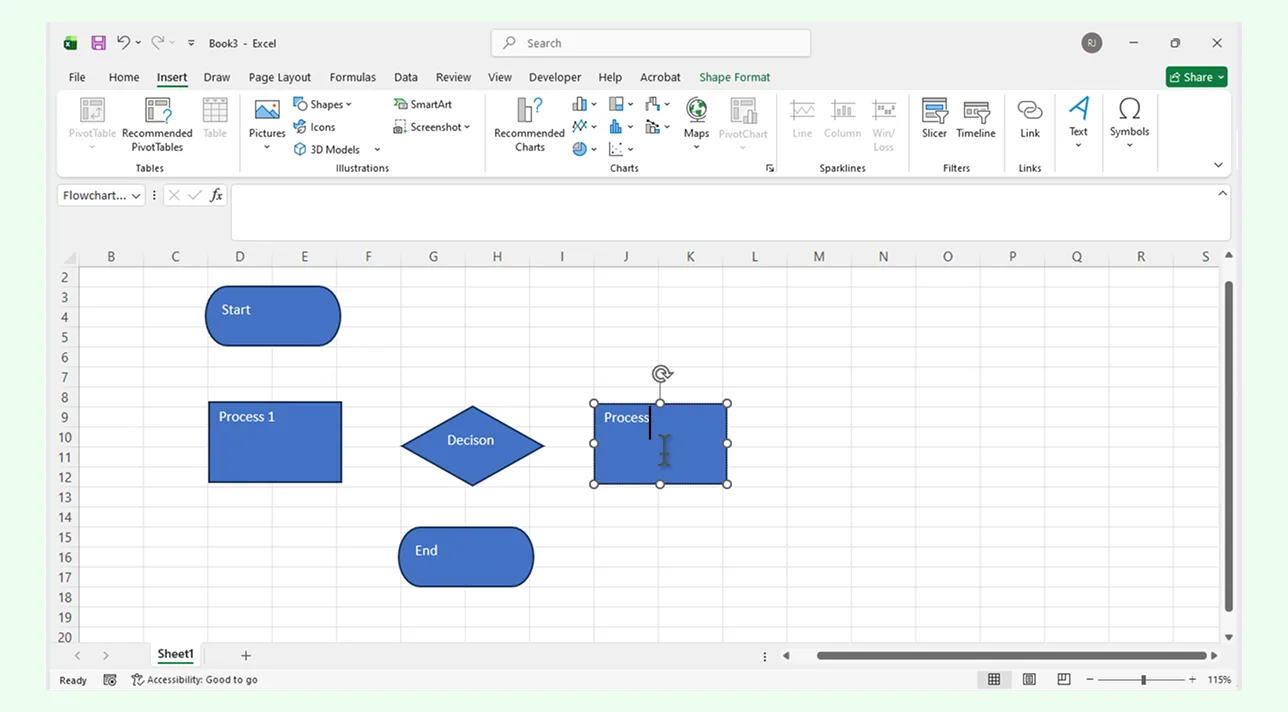
Click inside each shape and type the step name or action. You can resize shapes by dragging their edges, though keeping everything visually aligned may take a bit of manual adjustment.
Step 4: Connect the Shapes
Use Insert → Shapes → Lines and choose a connector rather than a free-standing line. Drag each endpoint to a connection point on a shape. When both ends are attached correctly, the connector remains connected as you move the shapes; you may still need to adjust routing and spacing as the map changes.
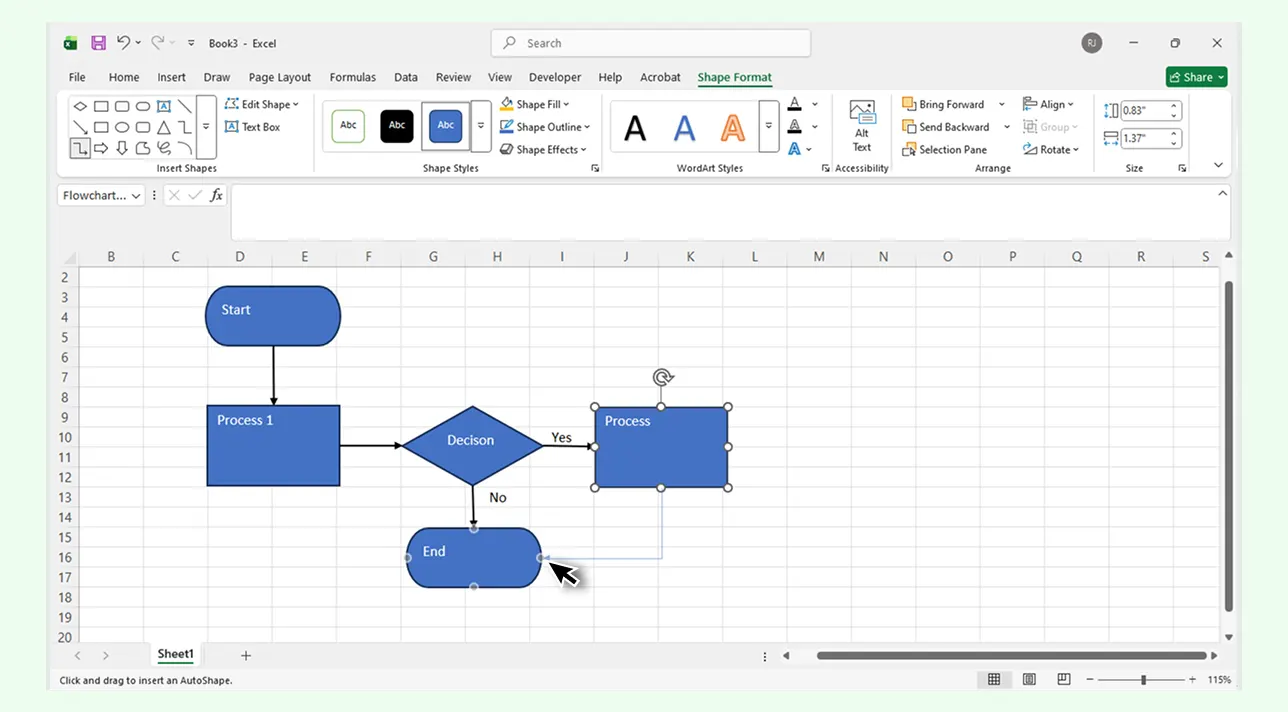
Step 5: Format Your Diagram
Use Shape Format options to change colors, outlines, fonts, and text alignment. Excel’s styling tools are basic, so refining the layout may take extra tweaking as the diagram grows.
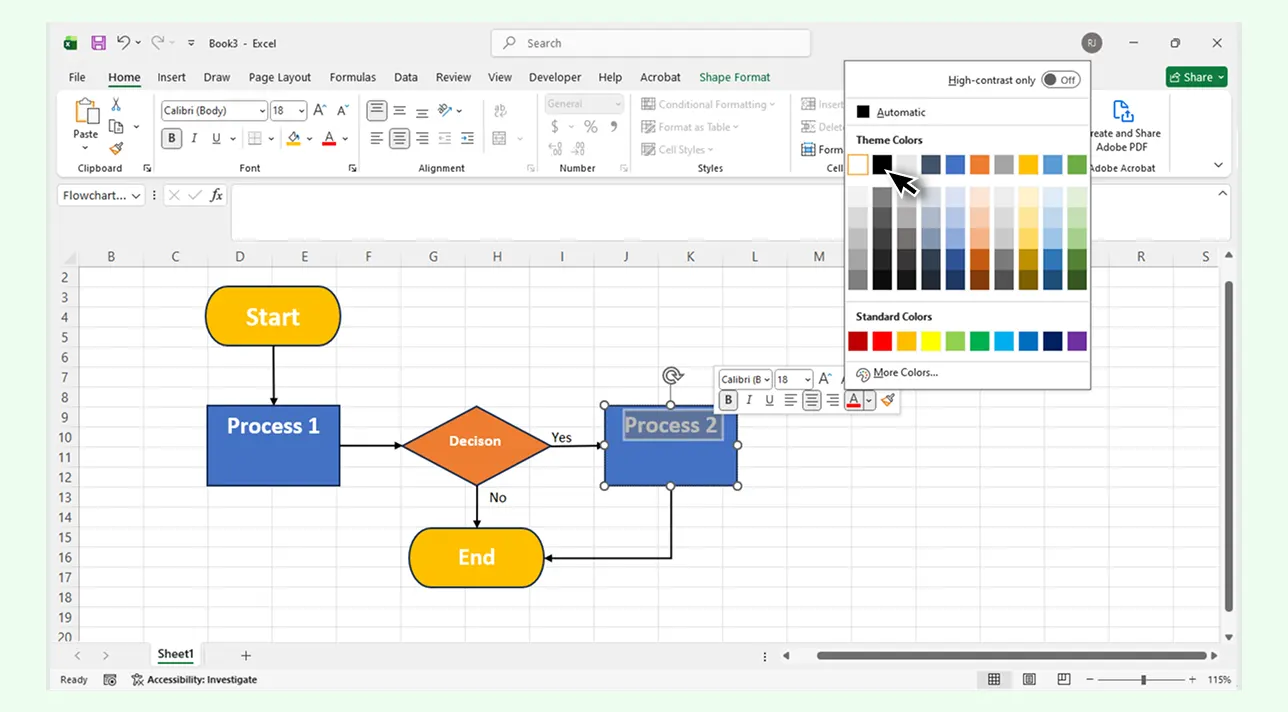
Step 6: Organize and Group the Elements
Select all relevant shapes and connectors → Right-click → Group. Grouping helps keep the diagram intact when moving or resizing, which is useful given Excel’s limited diagram structure controls.
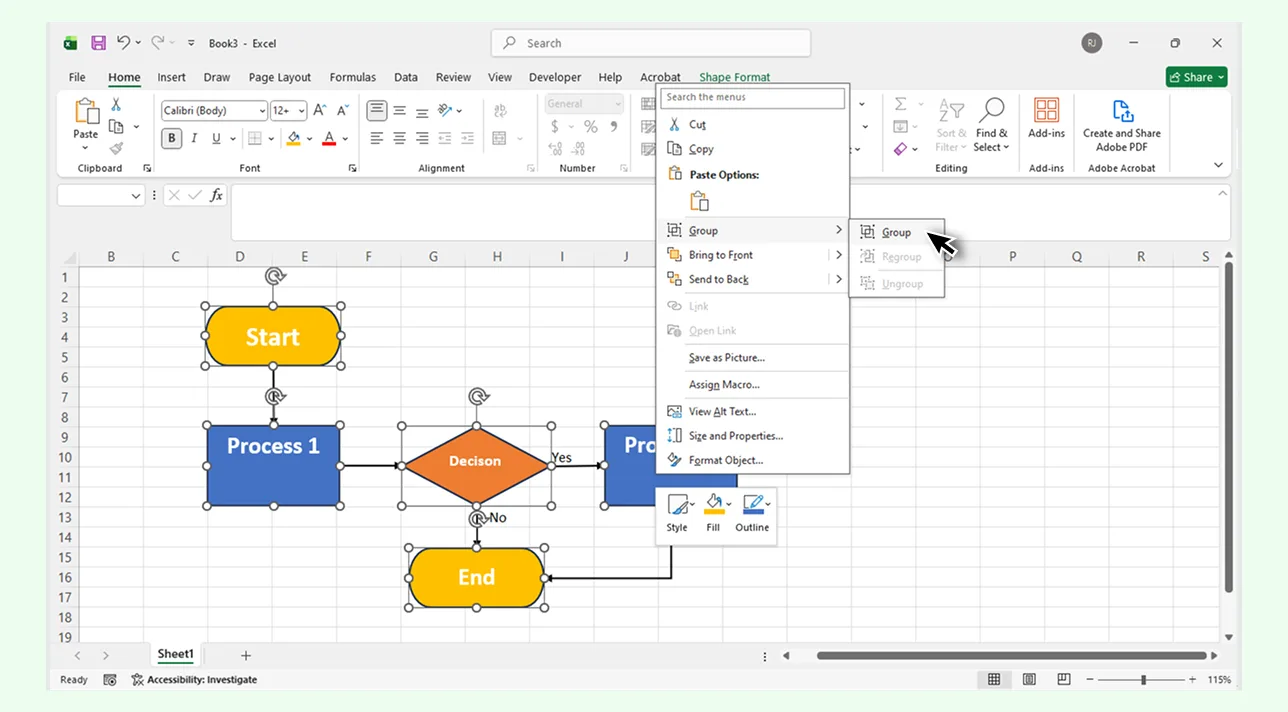
Step 7: Share or Export Your Process Map
Save the workbook normally for continued editing. To distribute a fixed version, use Save As or Export to create a PDF and check the print area, page orientation, scaling, and page breaks first. In supported desktop versions, you can also select a shape, grouped shapes, or SmartArt graphic and use Save as Picture. Confirm the exported file visually, especially for maps that span a large worksheet.
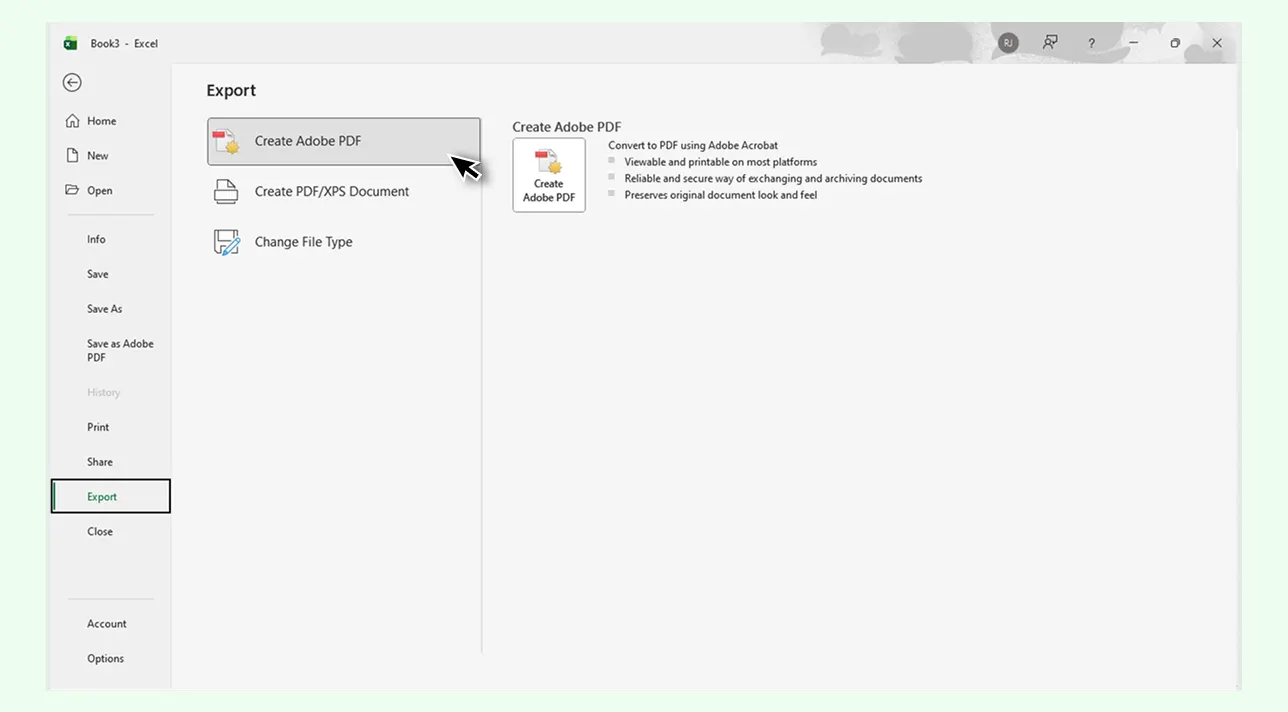
Challenges of Making a Process Map in Excel
Excel can create useful process visuals, but detailed maps require more manual setup and maintenance than a purpose-built diagramming tool.
Diagram structure is mostly manual: Flowchart shapes and connectors are available, but teams must decide the notation, arrange the map, and maintain its structure themselves.
SmartArt has practical limits: Process layouts automatically arrange simple sequences, but complex decisions, exceptions, loops, and cross-functional handoffs often need individual shapes and connectors.
Large maps are harder to navigate: A process can spread across many rows and columns, making overview-to-detail navigation and printing more difficult.
Process context is distributed: Excel can link shape text to cells and add hyperlinks to files or webpages, but notes, ownership details, evidence, and subprocess context are not organized as structured process documentation by default.
Collaboration depends on setup: Supported Microsoft 365 versions can co-author workbooks stored in OneDrive or SharePoint Online. However, collaboration remains workbook-centered, and teams still need a clear process for reviewing diagram feedback and maintaining an approved map.
Visual consistency takes effort: Shape styles, SmartArt styles, alignment tools, and grouping help, but detailed maps may require repeated formatting as they evolve.
Export requires preparation: PDF and picture export are available, but teams should configure the print area and verify the output when a map spans a large worksheet.
For teams that need dedicated process notation, linked subprocesses, structured ownership, and connected documentation, Creately’s process mapping software provides a process-focused alternative.
Why Creately is the Best Alternative for Creating a Process Map
If a process needs more than a basic spreadsheet diagram, Creately’s process mapping software provides a shared visual workspace for mapping, reviewing, and maintaining the workflow.
Ease of Use & Canvas Flexibility
Flexible visual canvas: Arrange current-state and future-state processes without fitting the map into worksheet cells or print-oriented page boundaries.
Overview and detail: Keep high-level process maps connected to detailed subprocess diagrams so different audiences can navigate to the context they need.
Symbols, Shapes & Templates
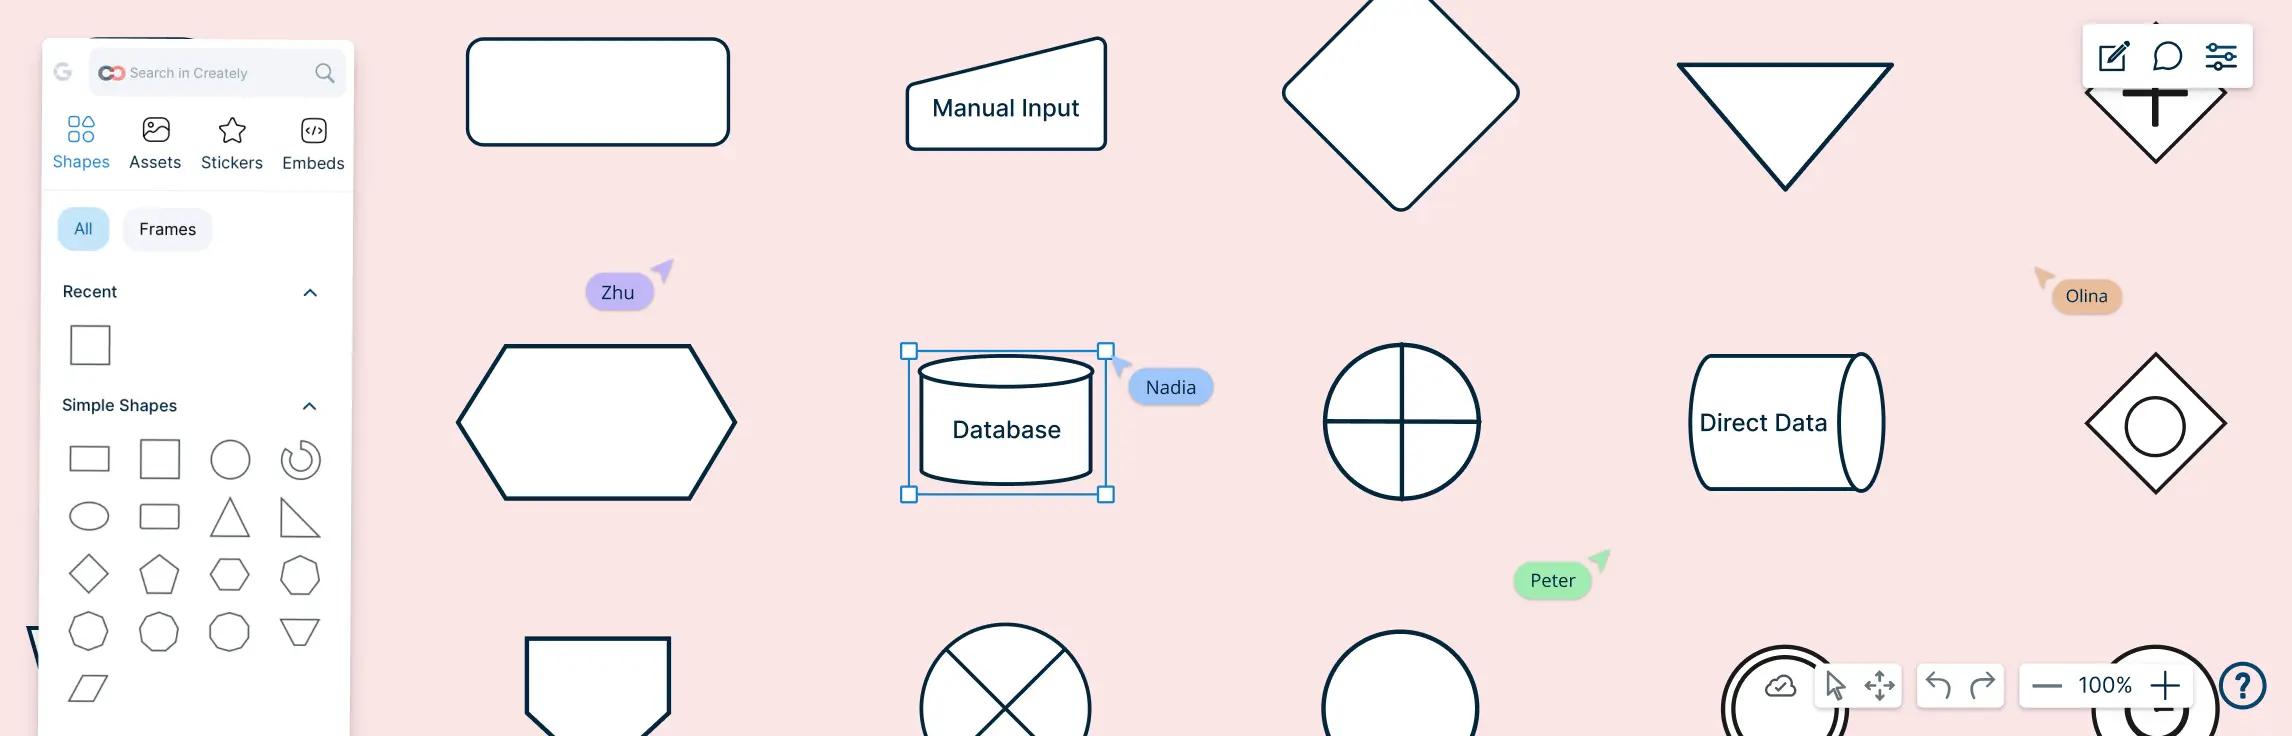
Process notation: Use flowchart symbols and BPMN 2.0 shapes for processes that require more precise decisions, events, responsibilities, and flows.
Ready-made templates: Start with templates for workflows, SOPs, swimlanes, value streams, and other process-mapping use cases, then adapt them to the organization’s terminology and evidence.
Reusable visual structures: Reuse proven layouts and conventions to create more consistent maps without implying that every reused diagram synchronizes automatically.
AI Flowchart Generator
Editable first draft: Creately AI can turn a plain-language process description into an editable flowchart with steps, decisions, and flow. Teams should validate the result with the people who perform the work and with available process data.
Automatic layout: Auto-layout can reorganize the generated or edited flow so teams spend less time manually aligning the first draft.
Connectors & Layout Behavior
Connected diagram elements: Connectors remain attached as shapes move, while diagram-focused alignment and spacing tools help maintain readable flow.
Multiple layout options: Automatic layouts can support vertical, horizontal, layered, and relationship-based views where they suit the process.
Styling & Visual Quality
Consistent visual language: Themes and styling controls help teams distinguish roles, decisions, exceptions, and stages while keeping notation readable.
Presentation-ready output: Diagram-focused formatting reduces the work required to turn a process map into a clear stakeholder-facing visual.
Collaboration & Teamwork
Real-time collaboration: Stakeholders can edit together, see collaborators’ cursors, and use contextual comments to discuss gaps, handoffs, and proposed changes.
Accountable maintenance: A process owner can incorporate agreed feedback and keep the map current. Formal approval should continue through the organization’s established governance process.
Scalability & Process Documentation
Connected process context: Add notes, links, and file attachments to relevant shapes, and use structured properties for details such as owner, status, duration, systems, or tags.
Linked subprocesses: Connect overview maps to detailed diagrams and organize related processes hierarchically for easier navigation.
Living documentation: Keep the map, supporting context, ownership, and review discussion together so the documented process can be maintained as work changes.
Creately Vs Excel: Which Is Better for Process Mapping?
Here’s how creating process maps in Excel compares to using Creately’s purpose-built process mapping tools.
| Feature | Excel | Creately |
|---|---|---|
| Process mapping symbols | Includes flowchart shapes and SmartArt Process layouts; specialized notation such as BPMN is not built in. | Provides flowchart and BPMN 2.0 shape libraries for simple and detailed process maps. |
| Connectors and layout | Attached connectors move with shapes, but routing and detailed layout usually require manual adjustment. | Provides attached connectors, diagram-focused guides, and automatic layout options. |
| Editing experience | Uses worksheet cells as the underlying workspace; shapes are positioned over the grid, while SmartArt can arrange simple sequences. | Uses a flexible visual canvas designed for diagrams and connected process views. |
| Styling and formatting | Includes shape formatting and SmartArt styles; maintaining a consistent detailed map is largely manual. | Provides diagram themes and styling controls for consistent process notation. |
| Templates | Includes SmartArt Process layouts but not a broad library of specialized process, SOP, BPMN, and swimlane templates. | Includes templates for process maps, workflows, SOPs, swimlanes, value streams, and related use cases. |
| Collaboration | Eligible Microsoft 365 versions support real-time co-authoring when the workbook is stored in OneDrive or SharePoint Online. | Supports real-time editing, collaborator cursors, and contextual comments in the visual workspace. |
| Scaling and navigation | Large maps can span many rows and columns and require manual navigation, grouping, and print setup. | Supports linked subprocess diagrams and hierarchical organization for moving between overview and detail. |
| Export options | Supports PDF export and, in supported desktop versions, saving selected graphics as picture files. | Supports PNG, PDF, and SVG export where available on the selected plan, along with workspace sharing. |
| Links and process context | Can link shape text to cell values and add hyperlinks to worksheet locations, files, or webpages. | Can keep notes, links, file attachments, structured properties, and linked subprocesses connected to relevant shapes. |
| Process documentation | Supporting information can live in workbook sheets and links, but process ownership and context are not structured by default. | Connects the visual map with ownership, supporting context, and collaborative review discussion as living documentation. |
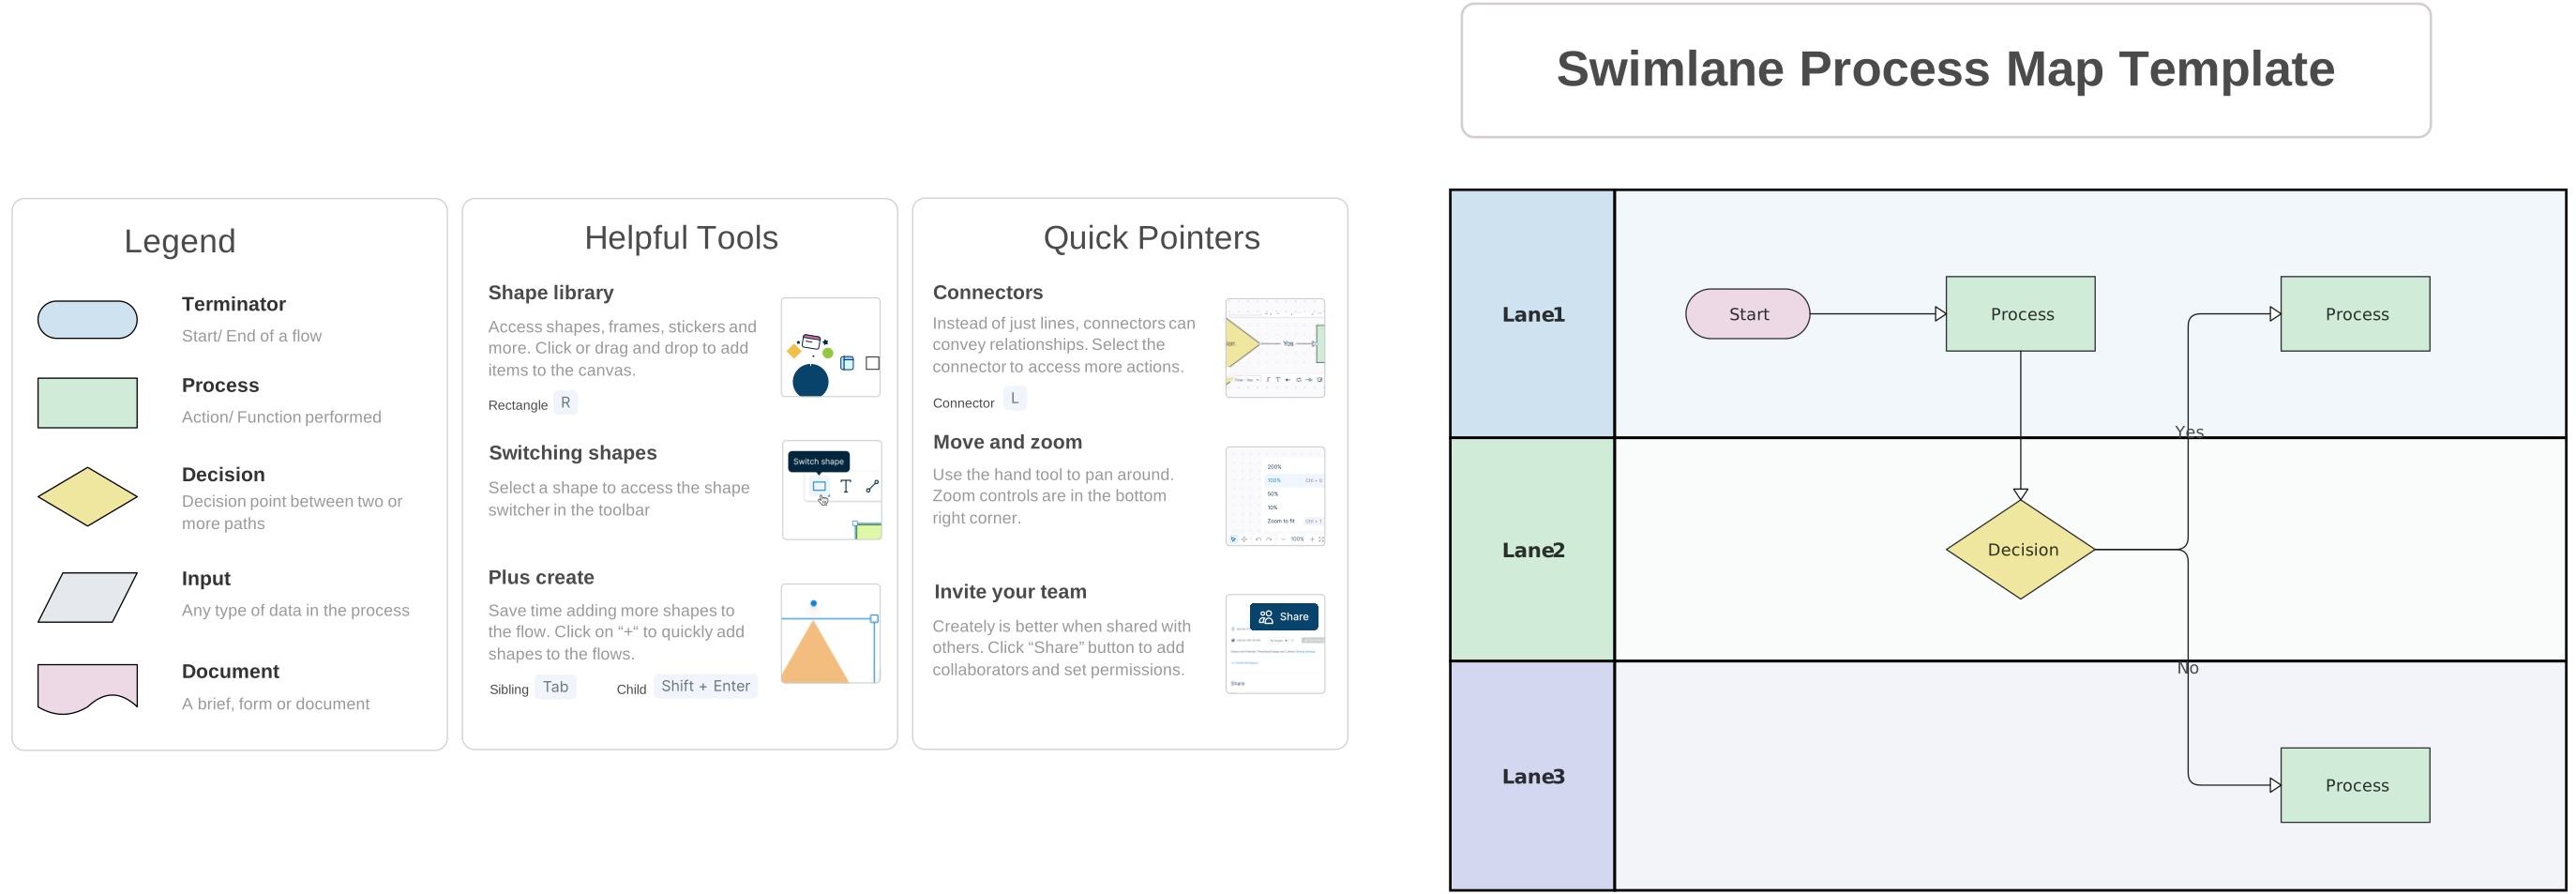
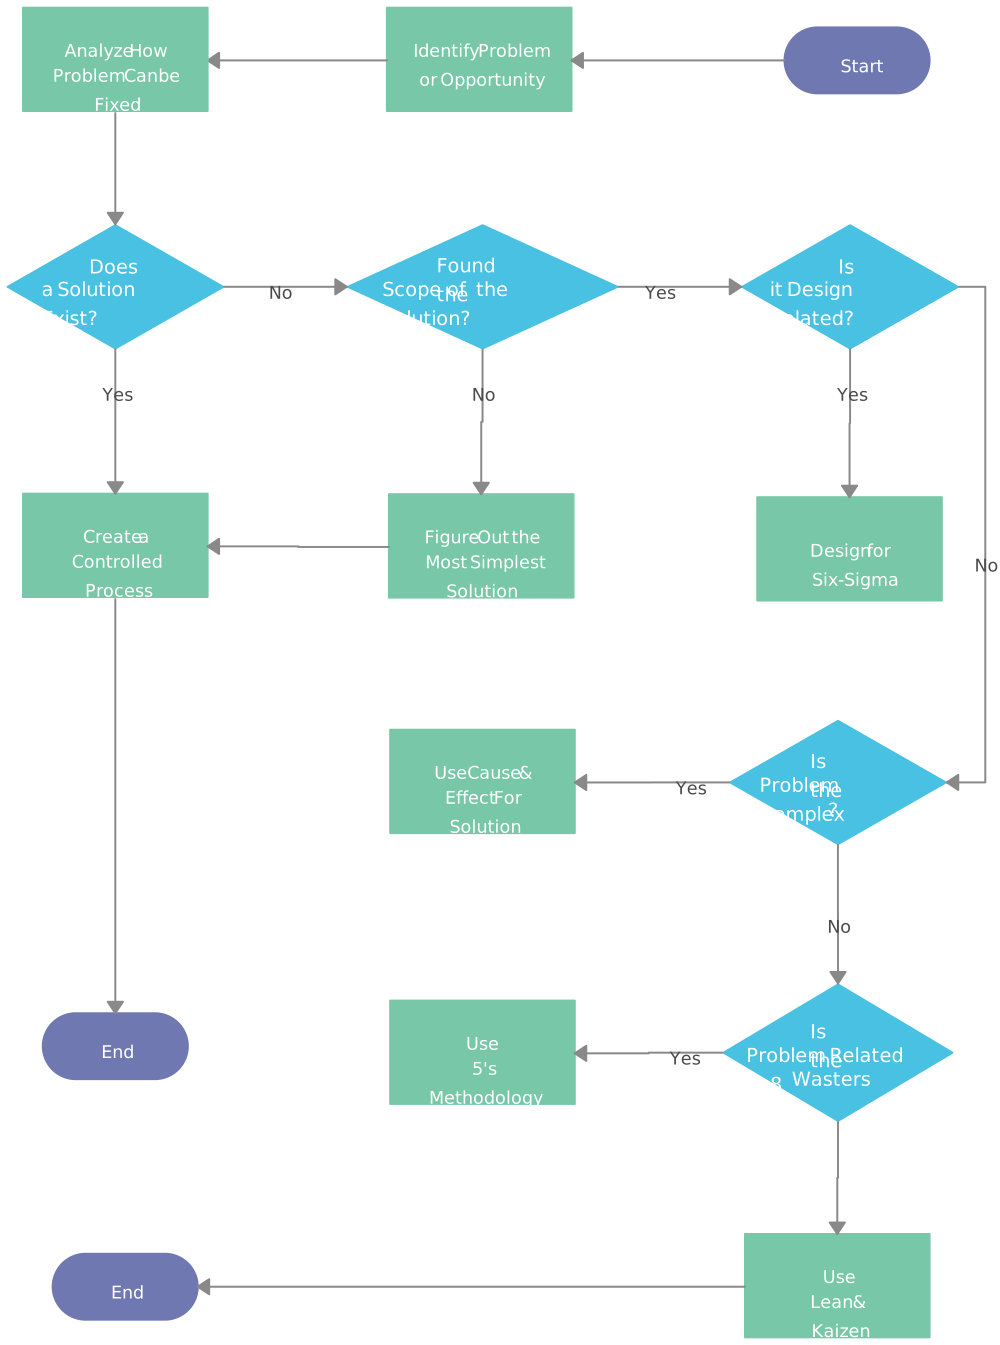
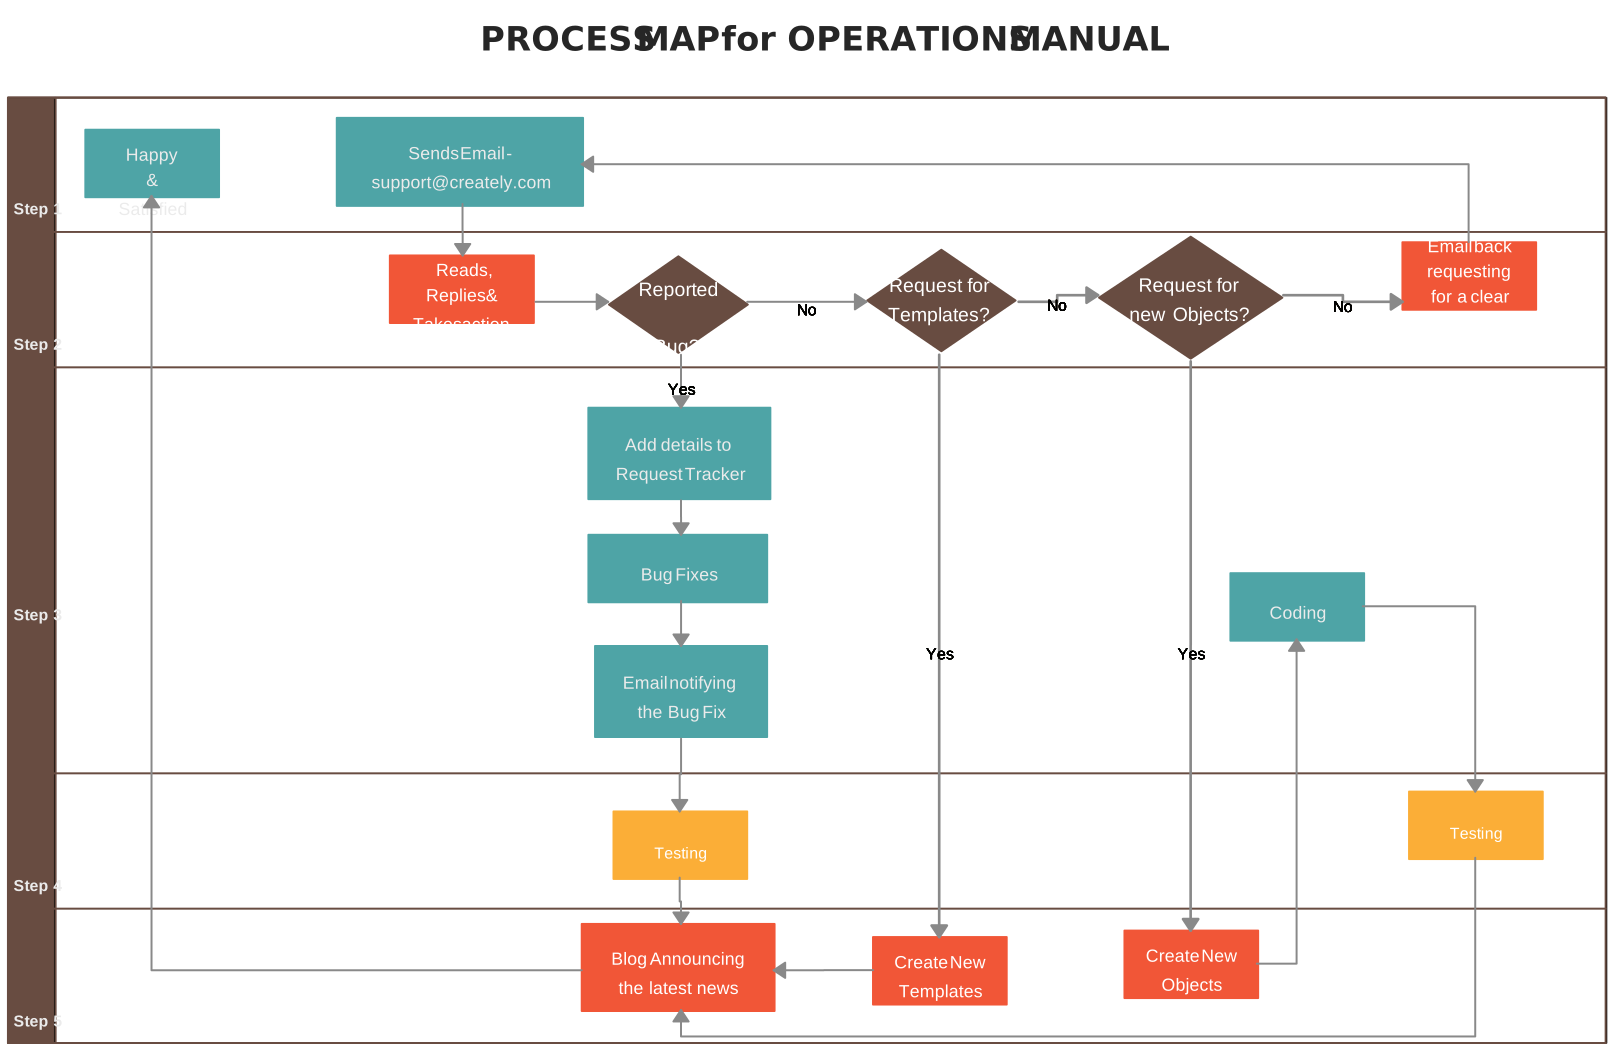
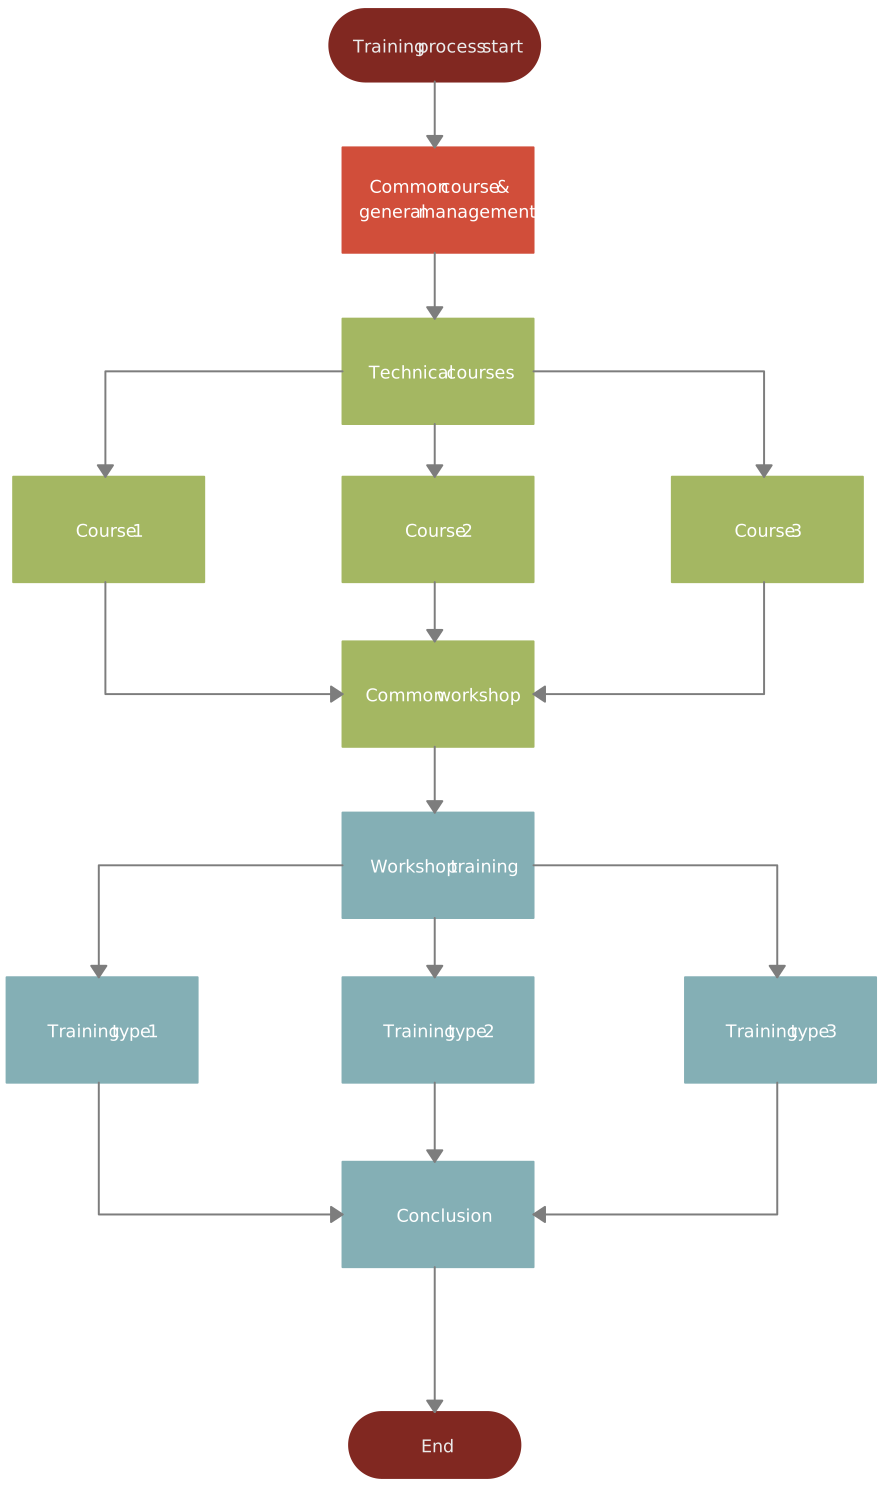
Free Process Map Templates to Get Started


Helpful Resources for Making Process Maps
Explore the different types of process maps and how they are used.
Learn step-by-step how to make a process map in Microsoft Word.
Understand the four levels of business process mapping.