Supply chain diagram examples show how materials, information, money and responsibilities flow from suppliers to end customers; they turn complex networks into a visual model teams can reason about. According to authoritative supply‑chain guidance, diagrams capture product, information, and capital movement across organizations.
1. Supply Chain Management Template
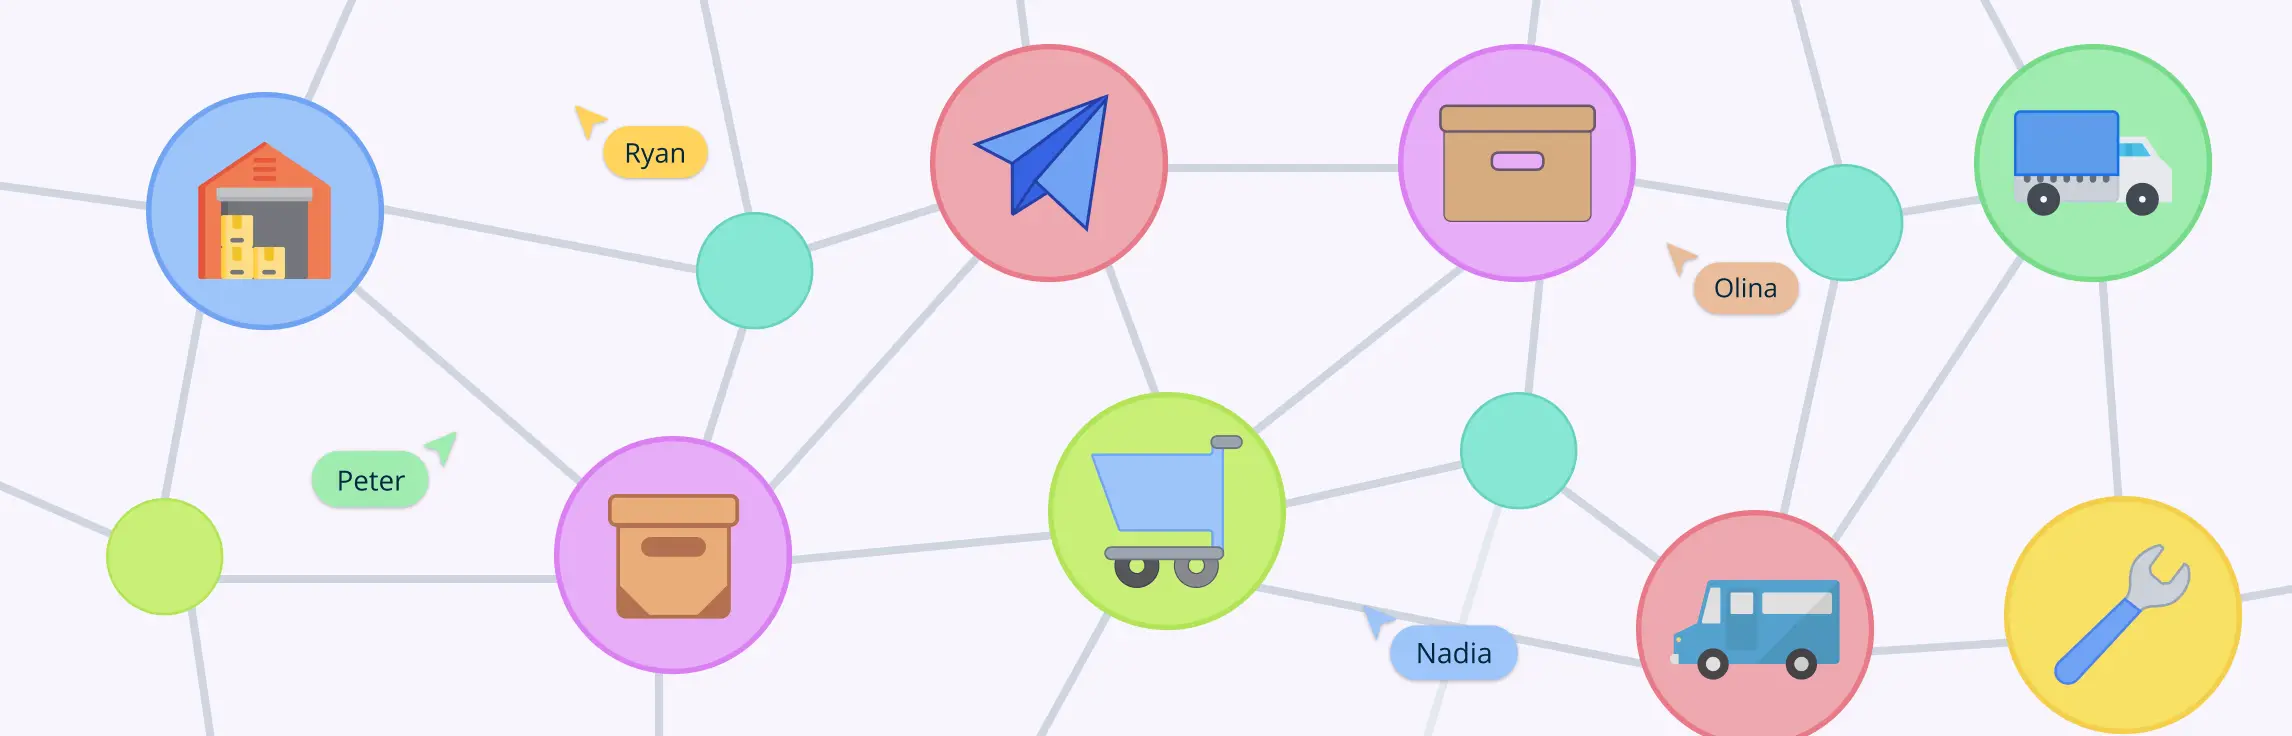
Today, agility is the only competitive advantage that lasts. This new supply chain management template is designed for businesses that prioritize data, speed, and direct-to-consumer (DTC) efficiency over old-school, rigid hierarchies.


- What it shows: A streamlined, circular, or hybrid flow that integrates e-commerce platforms, automated warehousing, and real-time data loops. It moves away from linear “silos” and focuses on a connected ecosystem where feedback from the customer flows instantly back to procurement.
- Practical use:
- Agile Pivoting: Quickly visualize how a change in a digital sales channel (like a social commerce spike) impacts your inventory orders.
- Tech Integration: Map out where your ERP, WMS, and AI-demand forecasting tools sit within the physical movement of goods.
- Quick customization checklist:
- Digital Touchpoints: Add icons for your tech stack (e.g., Shopify, NetSuite, or 3PL APIs).
- Feedback Loops: Use dashed lines to show how customer reviews or return data flow back to product design.
- Sustainability Metrics: Include a “Green Score” for nodes that utilize carbon-neutral shipping or recycled packaging.
- When to use: Perfect for investor pitches, internal restructuring, or when you need an editable supply chain diagram that reflects a modern, tech-heavy business model rather than a traditional factory line.
2. Supply Chain Management VSM Template
This is more than a supply chain flow chart; it’s a diagnostic tool. Value Stream Mapping (VSM) helps you see the “hidden” work and the hidden waste happening between your major milestones.

- What it shows: The dual flow of materials and information. It maps out lead times, cycle times, and work-in-process (WIP) levels to highlight exactly where inventory is piling up or where communication is stalling.
- Practical use:
- Waste Identification: Spot “non-value-added” steps that can be cut to lean out your operation.
- Bottleneck Detection: Identify the specific node that is throttling your entire throughput.
- Quick customization checklist:
- Data Boxes: Add cycle time ($C/T$), changeover time ($C/O$), and uptime percentages to each process block.
- Timeline Rail: Include a “Value-Added” vs. “Non-Value-Added” time ladder at the bottom.
- Kaizen Bursts: Use bright callouts to mark areas targeted for immediate improvement.
- When to use: Perfect for lean workshops, quarterly process audits, or whenever you need an editable supply chain diagram to prove that a specific process will change ROI.
3. Pharmaceutical Supply Chain Map
In the world of pharma, there is zero room for error. This supply chain flow chart is designed for high-stakes environments where a single degree of temperature deviation or a missed compliance check can compromise an entire batch.

- What it shows: A rigorous end-to-end journey from raw chemical API (Active Pharmaceutical Ingredient) sourcing to the “last mile” delivery at pharmacies or hospitals. It emphasizes cold chain logistics, regulatory checkpoints (like FDA or EMA), and serialization for track-and-trace.
- Practical use:
- Cold Chain Integrity: Ensuring temperature-sensitive products stay within strictly defined bounds.
- Audit Readiness: Providing a clear supply chain process diagram for inspectors to see how quality is controlled at every handoff.
- Quick customization checklist:
- Environment Sensors: Add icons for IoT temperature and humidity sensors at transit stages.
- Validation Steps: Include specific nodes for Quality Assurance (QA) release and lab testing.
- Regulatory Labels: Color-code stages that require specific compliance documentation (e.g., GMP or GDP).
- When to use: Crucial for logistics planning of vaccines or biologics, risk management meetings, and onboarding new distribution partners who need to understand the supply chain workflow diagram.
4. Coffee Supply Chain Map
Tracing a coffee bean from a high-altitude farm to a morning mug is a masterclass in global logistics. This supply chain flow chart template captures the vibrant, multi-continental journey of a commodity where timing and ethics are just as important as the flavor profile.

- What it shows: The transition from agricultural origins (harvesting and drying) to international shipping, roasting, and final retail. It highlights the critical handoffs between farmers, exporters, roasters, and baristas.
- Practical use:
- Transparency & Fair Trade: Easily track and display certification points to ensure ethical sourcing standards are met.
- Lead Time Management: Visualize the long “sea-leg” of the journey to better predict inventory needs during seasonal shifts.
- Quick customization checklist:
- Origin Markers: Tag specific regions (e.g., Ethiopia, Colombia) and note the harvest seasons.
- Quality Gates: Add nodes for “Cupping” and moisture testing to ensure quality remains consistent during transit.
- Sustainability Badges: Use icons to mark Fair Trade, Rainforest Alliance, or Organic checkpoints.
- When to use: Ideal for sustainability reporting, storytelling in marketing materials, or when you need to create a supply chain diagram that helps stakeholders understand the complexity behind a “simple” cup of coffee.
5. Garment Manufacturing Supply Chain Map
The garment industry moves at lightning speed, and keeping track of zippers, fabric, and labels across three different continents is a major feat. This supply chain flowchart brings “Fast Fashion” logic into a clear, manageable structure, ensuring your collection doesn’t get stuck in port while the trend fades.

- What it shows: The intricate web of soft-goods production—from raw fiber sourcing and textile mills to garment construction (cut-make-trim), quality control, and global shipping to retail hubs.
- Practical use:
- BOM Tracking: Ensures all components (buttons, threads, fabrics) arrive at the factory simultaneously to avoid production halts.
- Vendor Management: Clearly maps out tier-1 and tier-2 suppliers to monitor production capacity and ethical standards.
- Quick customization checklist:
- Seasonality Tags: Mark different flows for “Spring/Summer” vs. “Fall/Winter” to account for different logistics speeds.
- Quality Inspection Points: Insert icons for “In-line Inspection” and “Final Random Inspection” (FRI).
- Duty & Tariff Zones: Color-code international borders where customs clearance and duties impact your lead time.
- When to use: Use this supply chain workflow diagram during seasonal planning, supplier onboarding, or when you’re looking to create a supply chain diagram that explains your production timeline to the marketing and sales teams.
6. Manufacturing Process Flowchart
While the high-level strategy is great, the Manufacturing Process Flowchart is where the rubber meets the road. This is a “boots on the ground” supply chain process diagram that zooms into the factory floor to ensure every machine, person, and part is moving in perfect harmony.

- What it shows: The granular, step-by-step transformation of raw materials into finished goods. It covers everything from initial fabrication and assembly to sub-assembly testing and final packaging.
- Practical use:
- Standard Operating Procedures (SOPs): Serves as a visual guide for floor workers to ensure consistency and safety.
- Throughput Optimization: Helps operations leads identify “starved” or “blocked” stations where the line is losing momentum.
- Quick customization checklist:
- Work Centers: Label specific machinery or departments (e.g., CNC Machining, Welding, Assembly Line A).
- Quality Gates: Insert “Go/No-Go” decision diamonds to indicate where products must pass inspection before moving forward.
- Cycle Time Annotations: Add the average time each station takes to help with load balancing.
- When to use: Essential for daily stand-up meetings, floor layout planning, and training new hires on the specific supply chain workflow diagram they’ll be operating within.
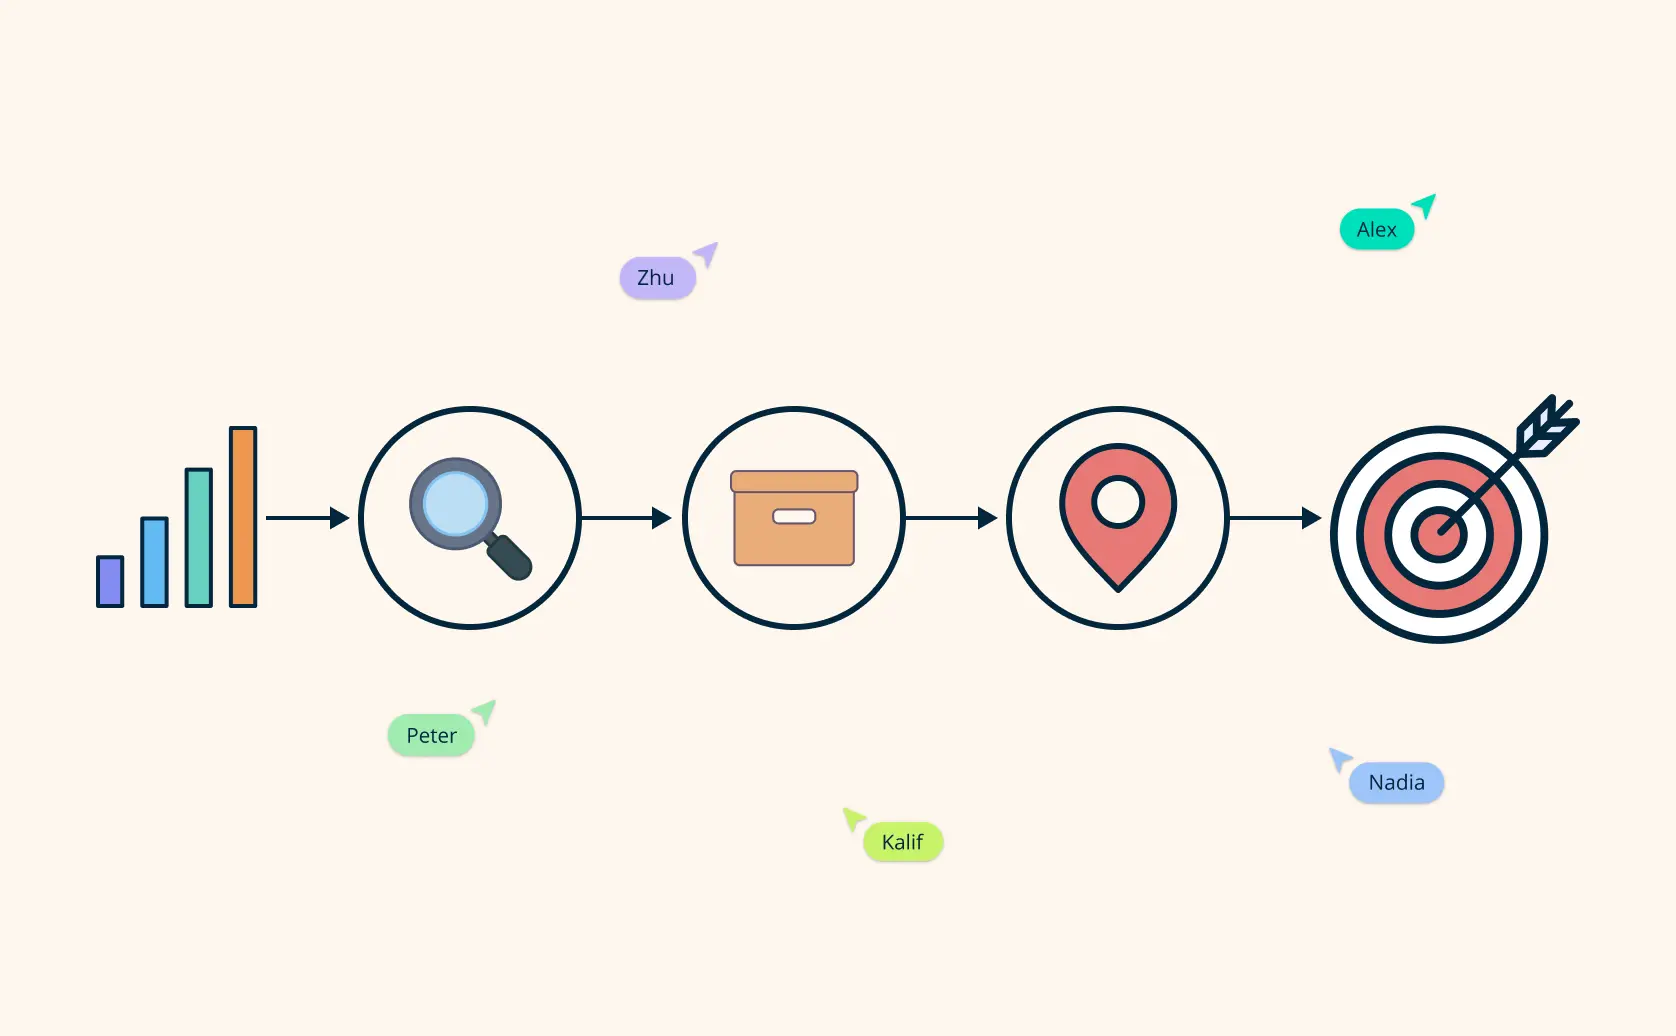
7. Customer Order Process Flow Chart
This customer order process flowchart maps the critical handoffs between your digital storefront and the customer’s doorstep, ensuring no package (or customer) gets left behind.

- What it shows: The sequence of events triggered by a purchase, including payment verification, warehouse picking/packing, shipping label generation, and final-mile delivery updates.
- Practical use:
- Customer Experience (CX) Mapping: Identify where “radio silence” occurs and insert automated notification triggers to keep customers informed.
- Error Reduction: Spot manual data entry points that could be automated to prevent shipping address errors.
- Quick customization checklist:
- Trigger Points: Mark where automated emails (Order Confirmed, Shipped, Delivered) are sent.
- Exception Paths: Add branches for “Out of Stock” scenarios or “Failed Payment” workflows.
- Return Loops: Include a clear path for how a customer initiates a return or exchange.
- When to use: Use this supply chain flow chart template when scaling your fulfillment team, integrating a new 3PL, or auditing your shipping speeds for a holiday peak.
8. Spaghetti Diagram for Retail & Warehousing
This isn’t your typical supply chain flow chart; it’s a physical map of movement that exposes the “hidden” chaos of a poorly planned layout.

- What it shows: The actual path taken by a person or product through a process. By drawing lines (the “spaghetti”) for every movement, you’ll quickly see where paths cross, where people are backtracking, and where the “traffic jams” are happening.
- Practical use:
- Motion Waste Reduction: Identify unnecessary walking or transport time that adds zero value to the order.
- Layout Redesign: Provides visual proof that moving the “high-velocity” items closer to the packing station will save hours of labor.
- Quick customization checklist:
- Color-Coded Paths: Use different colors for different roles (e.g., Pickers vs. Restockers) to see where they collide.
- Distance Totals: Annotate the “before” and “after” total walking distance to calculate time saved.
- Heat Zones: Highlight areas where lines are densest to identify the need for wider aisles or better signage.
- When to use: Essential for warehouse managers during a 5S audit, retail store managers optimizing floor flow, or anyone looking to create a supply chain diagram that solves real-world physical friction.
From Scattered Workflows to Seamless Execution
At the end of the day, a supply chain flow chart is more than just a collection of boxes and arrows; it’s your roadmap to a calmer, more profitable business. Whether you’re untangling a warehouse layout with a spaghetti diagram or tracking global ethics through a coffee supply chain map, the goal is the same: clarity.
The frustration of “not knowing where things stand” is a productivity killer. By using Creately’s editable supply chain diagram, you’re not just documenting a process; you’re empowering your team to spot bottlenecks before they become crises. You’re moving away from reactive firefighting and toward proactive, visual thinking.
Helpful Resources
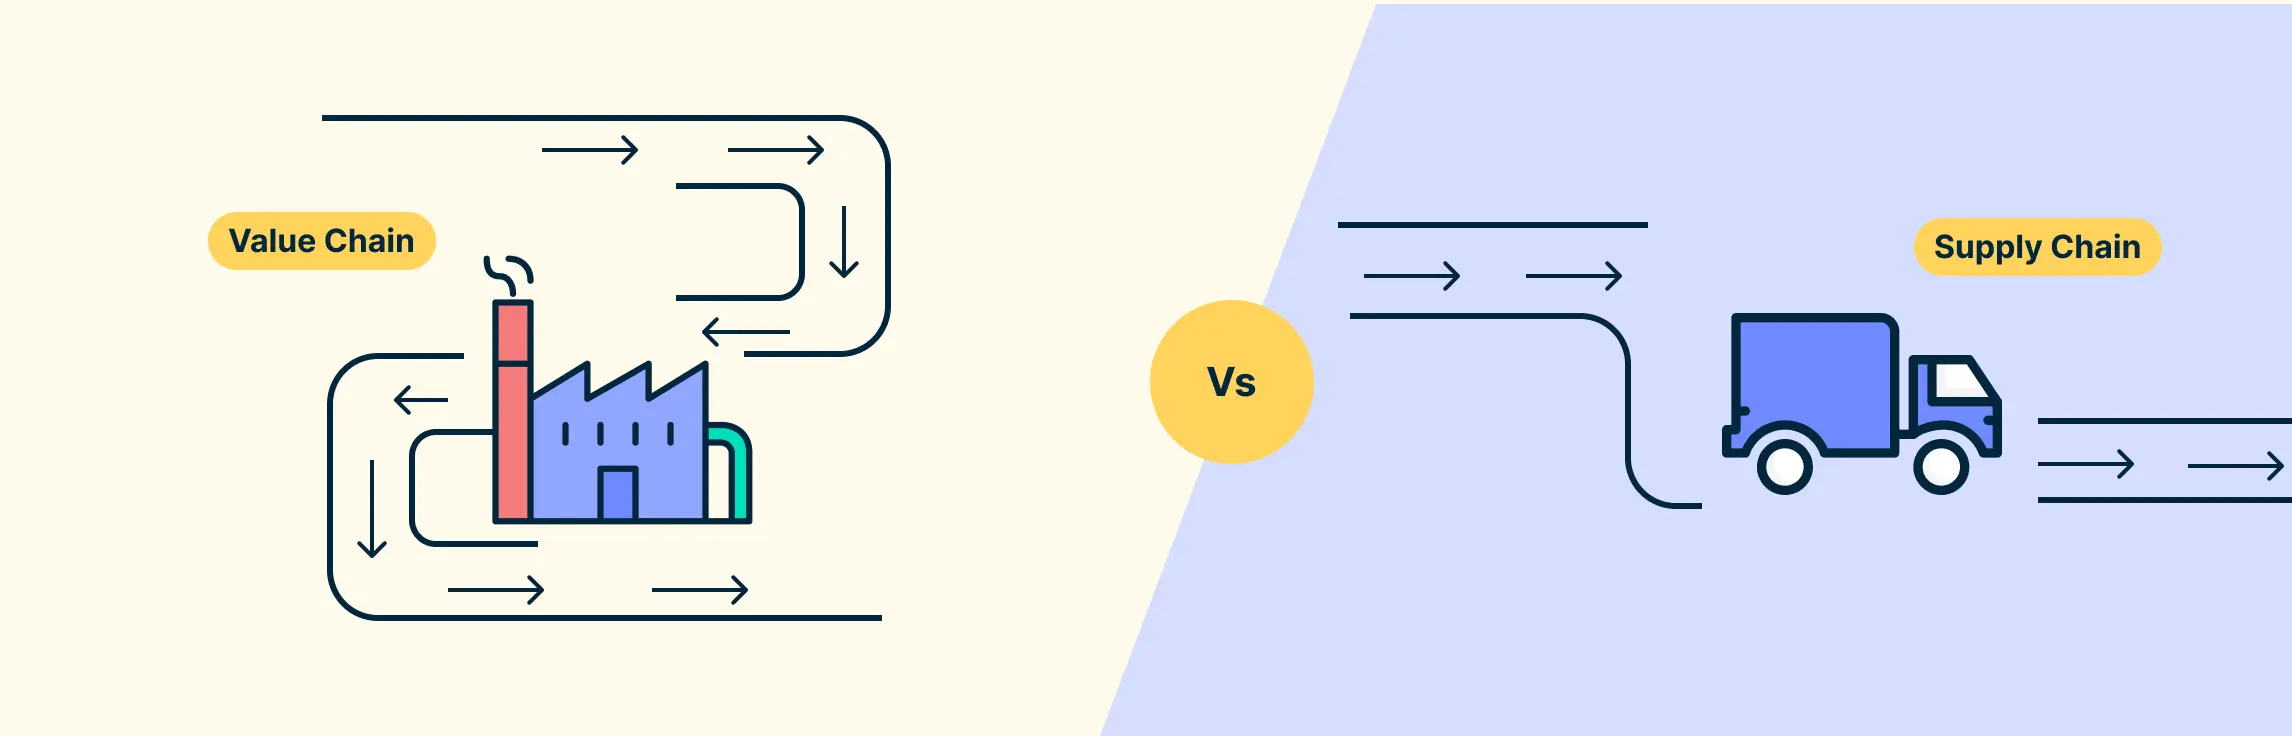
Map out your value chain easily to identify ways you can improve processes to add more value to your products & customers.
Use mind maps to visualize ideas and concepts for collaborative brainstorming, problem-solving, and so much more.
This Gantt chart tutorial will help you master the art of creating visual timelines for tasks and milestones
Resources:
Gardner, J.T. and Cooper, M.C. (2003). STRATEGIC SUPPLY CHAIN MAPPING APPROACHES. Journal of Business Logistics, 24(2), pp.37–64. doi:www.doi.org/10.1002/j.2158-1592.2003.tb00045.x.
MacCarthy, B.L., Ahmed, W.A.H. and Demirel, G. (2022). Mapping the supply chain: Why, what and how? International Journal of Production Economics, [online] 250(1). doi:www.doi.org/10.1016/j.ijpe.2022.108688.