Archive of posts - Pert Chart

PERT Chart vs Gantt Chart: Key Differences and When to Use Each 21 November 2024 | 19 min read
PERT Chart vs Gantt Chart: Key Differences and When to Use Each

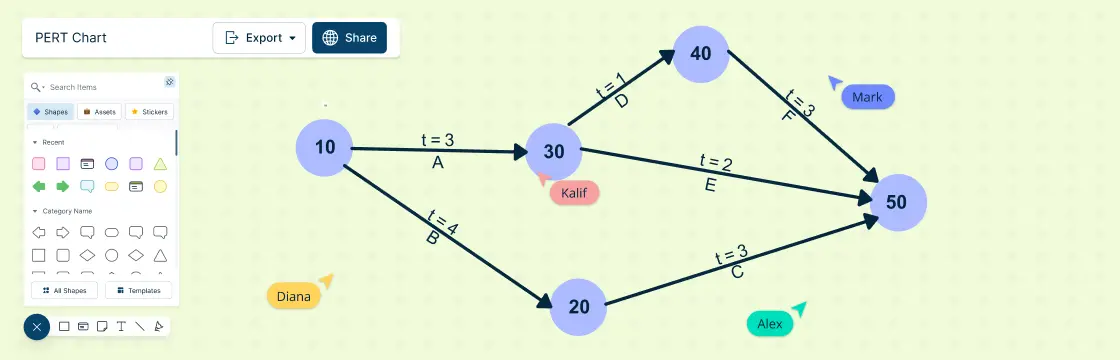
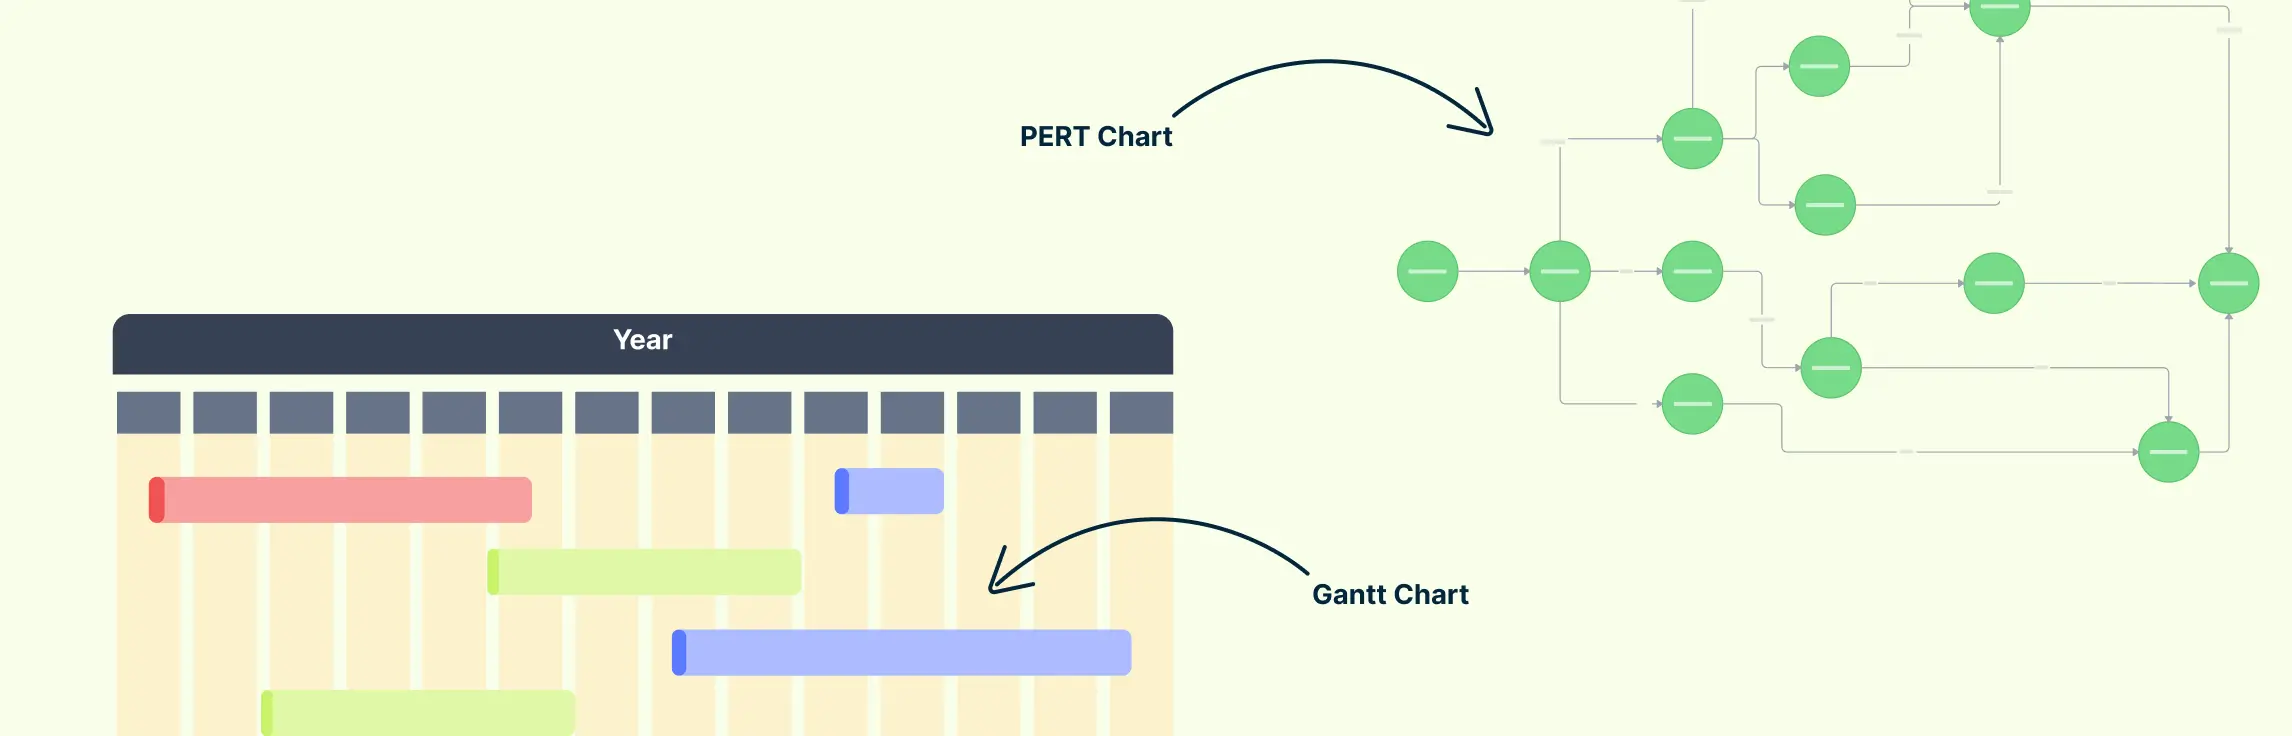
Overview of Project Management Charts In project management, PERT Chart vs Gantt Chart emerges as a key comparison for determining the most effective approach to task scheduling and resource allocation. Both tools are indispensable for visual collaboration and offer unique perspectives on project execution. However, their methodologies and applications vary significantly, making the PERT Chart vs Gantt Chart debate crucial for project managers.

What is a PERT Chart and How to Create One (with Templates) 22 February 2024 | 7 min read
What is a PERT Chart and How to Create One (with Templates)

A PERT chart is a graphical tool that helps you visualize the tasks, dependencies, and milestones of your project. In this blog post, we’ll explain what a PERT chart is, how it originated, what it can be used for.